Export Quantity & Value for Chinese Home Sewing Machine from Jan. to Dec. 2013
| Month | Quantity (Set) | Value (USD) | Year on Year | |
| Quantity | Value | |||
| Jan. | 757,068 | 32,990,603 | 21.4% | 17.5% |
| Feb. | 633,549 | 21,405,587 | 64.2% | -20.6% |
| March | 707,190 | 30,401,929 | -25.5% | -14% |
| April | 670,309 | 25,734,972 | -19.9% | -33.6% |
| May | 646,991 | 25,817,335 | -34.1% | -31% |
| June | 647,041 | 26,145,475 | -27.2% | -24.9% |
| July | 1,008,745 | 44,993,383 | -10.1% | 4% |
| August | 833,498 | 40,008,825 | -1.8% | 19% |
| Sep. | 1,016,738 | 40,169,658 | 16.6% | -5.8% |
| Oct. | 766,178 | 32,528,433 | -22.7% | -17% |
| Nov. | 1,047,827 | 35,364,869 | 57.8% | 3.6% |
| Dec. | 875,934 | 35,487,190 | 11.4% | 10.7% |
| Total from Jan. to Dec. | 9,611,068 | 391,048,259 | -3.4% | -8.3% |
The total export quantity for Chinese home sewing machine from Jan. to Dec. 2013 achieved 9.6111 million sets, and declined 3.4% year on year. The total export value reached 391 million USD, and declined 8.3% year on year
Major Countries/Regions for Chinese Home Sewing Machine Export from Jan. to Dec. 2013
| No. | Countries/Regions | Quantity (Set) | Value (USD) | Year on Year | |
| Quantity | Value | ||||
| 1 | USA | 1,693,126 | 105,571,659 | -4.9% | -10.2% |
| 2 | Japan | 513,501 | 38,729,280 | 26.6% | -1.5% |
| 3 | Germany | 354,784 | 34,357,124 | 2.9% | 10.4% |
| 4 | Russian Federation | 681,761 | 27,211,108 | -20.8% | -28.5% |
| 5 | Netherlands | 213,022 | 11,766,400 | -27.1% | -20.5% |
| 6 | Nigeria | 359,977 | 11,072,621 | 57% | 59.7% |
| 7 | Bangladesh | 430,389 | 10,341,794 | 4% | -0.9% |
| 8 | Brazil | 282,211 | 9,530,104 | -33.5% | -37.7% |
| 9 | United Kingdom | 167,891 | 7,978,272 | -28% | -24.8% |
| 10 | Chile | 186,648 | 7,437,183 | 19.4% | 21.9% |
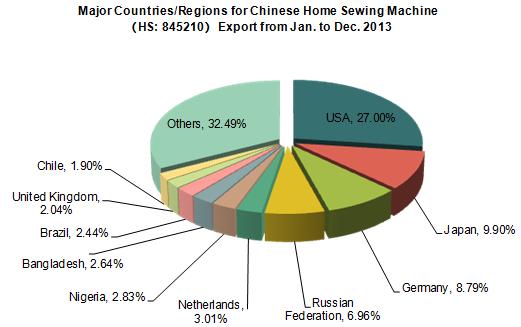
USA ranked first for Chinese home sewing machine export. The total export value to USA for Chinese home sewing machine from Jan. to Dec. 2013 was about 106 million USD, declined 10.2% year on year, and occupied 27% of all. Followed by Japan, and occupied 9.9%.
Major Cities/Provinces for Chinese Home Sewing Machine Export from Jan. to Dec. 2013
| No. | Cities/Provinces | Quantity (Set) | Value (USD) | Year on Year | |
| Quantity | Value | ||||
| 1 | Guangdong | 3,020,040 | 138,841,494 | -16.8% | -19.3% |
| 2 | Zhejiang | 4,580,668 | 95,202,981 | 9% | 1.4% |
| 3 | Shanghai | 579,154 | 79,713,454 | -0.8% | -5.7% |
| 4 | Jiangsu | 1,167,616 | 65,359,077 | -10.4% | 2.2% |
| 5 | Tianjin | 180,582 | 9,654,697 | -12.7% | -4.9% |
| 6 | Anhui | 5,138 | 526,117 | 1065.1% | 2452.2% |
| 7 | Xinjiang | 20,493 | 426,667 | 1281.9% | 626.4% |
| 8 | Chongqing | 2,268 | 359,125 | 12.9% | 37.1% |
| 9 | Jiangxi | 1,569 | 183,272 | 189% | 80.2% |
| 10 | Shandong | 40,015 | 179,066 | 2339.9% | 117.3% |
The major cities/provinces for Chinese home sewing machine export were Guangdong, Zhejiang, Shanghai and Jiangsu, which together occupied 97.26% and 96.95% of the total export quantity & value from Jan. to Dec. 2013 respectively. The export quantity of Shandong & the export value of Anhui increased significantly among the top 10 cities/provinces for Chinese home sewing machine, which were 2339.9% and 2452.2% year on year respectively.


