2011-2013 Canada Computer Industry Import Performance
2011-2013 Canada Computer Industry Import Value Annual Trend
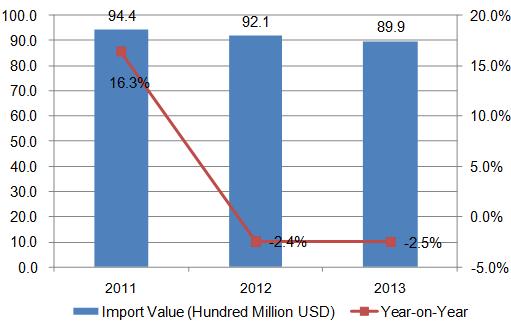
From 2011 to 2013 Canada's Computer import values are delcined year by year; the three-year imports are 94.4 billion US dollars, 92.1 billion US dollars and 89.9 billion US dollars.
2011-2013 Canada Computer Industry Major Import Market Trend Analysis
| No. | Countries/ Regions | Import Value(USD) | Growth in 2013 compared with 2011 | ||
| 2011 | 2012 | 2013 | |||
| Total | 9,443,724 | 9,213,346 | 8,986,334 | -4.8% | |
| 1 | China | 4,977,235 | 5,154,709 | 5,133,347 | 3.1% |
| 2 | USA | 2,007,897 | 1,921,455 | 1,894,529 | -5.6% |
| 3 | Mexico | 917,922 | 976,772 | 938,866 | 2.3% |
| 4 | Thailand | 179,347 | 157,480 | 163,787 | -8.7% |
| 5 | Taiwan | 624,096 | 250,949 | 150,148 | -75.9% |
| 6 | Malaysia | 140,371 | 164,301 | 143,467 | 2.2% |
| 7 | Viet Nam | 3,114 | 3,945 | 122,464 | 3832.7% |
| 8 | Republic of Korea | 69,531 | 79,895 | 55,662 | -19.9% |
| 9 | Hungary | 58,382 | 64,284 | 52,954 | -9.3% |
| 10 | Japan | 122,263 | 114,358 | 52,812 | -56.8% |
From 2013, China was Canada's largest original places of imported goods, 57.1% of Canada's import product are from China.In 2013, the imports from Viet Nam to Canada increased 3832.7% than 2011, which grows fastest; the imports from Taiwan to Japan declined 75.9% and 56.8% than 2011, which declined obiviously.
| No. | Countries/ Regions | Import Value Share | ||
| 2011 | 2012 | 2013 | ||
| 1 | China↑ | 52.7% | 55.9% | 57.1% |
| 2 | USA | 21.3% | 20.9% | 21.1% |
| 3 | Mexico | 9.7% | 10.6% | 10.4% |
| 4 | Thailand | 1.9% | 1.7% | 1.8% |
| 5 | Taiwan↓ | 6.6% | 2.7% | 1.7% |
| 6 | Malaysia | 1.5% | 1.8% | 1.6% |
| 7 | Viet Nam↑ | 0.0% | 0.0% | 1.4% |
| 8 | Republic of Korea | 0.7% | 0.9% | 0.6% |
| 9 | Hungary | 0.6% | 0.7% | 0.6% |
| 10 | Japan↓ | 1.3% | 1.2% | 0.6% |
Note: “↑”represents that the indicators listed, continued to increase from 2011 to 2013, “↓”represents that the indicators listed, continued to decrease from 2011 to 2013.
From 2011-2013 , among the Canada's first ten import markets, the imports value share of China and Viet Nam increased year by year, the share of Taiwan and Japan goes down with each passing year.
2014 Canada Computer Import Performance
| Countries/ Regions | 2014 Import Value(Thousand USD) | Year-on-Year | Share |
| Total | 8,880,915 | -1.2% | 100% |
| China | 4,924,181 | -4.1% | 55.4% |
| USA | 1,799,396 | -5.0% | 20.3% |
| Mexico | 1,124,494 | 19.8% | 12.7% |
| Thailand | 173,838 | 6.1% | 2.0% |
| Viet Nam | 160,710 | 31.2% | 1.8% |
| Taiwan | 149,936 | -0.1% | 1.7% |
| Malaysia | 103,525 | -27.8% | 1.2% |
| Japan | 74,982 | 42.0% | 0.8% |
| Germany | 55,373 | 14.4% | 0.6% |
| Singapore | 40,752 | -19.0% | 0.5% |
Canada Computer Industry Major Import Countries/ Regions Distribution, from Jan. to Dec. 2014
From 2014, the Canada Computer Import value was 88.81 billion US dollars, which declined 1.2% year on year. In 2014, the imports from China to Canada was 49.24 billion US dollars, China is Canda's major original places of imported goods.
Source: UN Comtrade


