Major Export Countries / Regions for Chinese Inorganic Chemicals, from Jan. to Dec. 2014 (by Export Value)
| No. | Countries/Regions | Grand Total from Jan. to Dec. | Total Compared to the Same Period of 2013 | ||
| Volume(-) | Value(USD) | Volume | Value | ||
| 1 | Japan | 1,365,179,419 | 1,953,817,979 | 4.7% | 14.4% |
| 2 | Korea | 1,993,523,260 | 1,944,037,910 | -3.3% | 18.8% |
| 3 | USA | 1,228,561,913 | 1,469,717,433 | 21% | 10.8% |
| 4 | Thailand | 1,126,785,572 | 687,188,236 | 5.1% | 12.8% |
| 5 | Taiwan | 705,435,529 | 652,327,337 | 4.5% | -3.9% |
| 6 | India | 765,431,365 | 650,585,981 | 7% | 10.6% |
| 7 | Indonesia | 1,207,899,710 | 496,348,350 | 6.2% | 4% |
| 8 | Hong Kong | 264,219,223 | 474,783,309 | 0.1% | 21.7% |
| 9 | Malaysia | 900,169,568 | 469,450,782 | 4.3% | 15.6% |
| 10 | Netherlands | 202,150,685 | 435,835,064 | 24.4% | 16.5% |
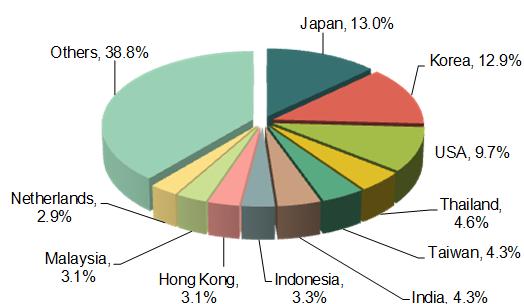
From Jan. to Dec.2014, the major export countries and regions for Chinese Inorganic Chemicals were Japan, Korea, USA, Thailand, Taiwan, India, Indonesia, Hong Kong, Malaysia, and Netherlands and so on. Japan and Korea were the major export markets, the export value to them accounted for 13% and 12.9% of the total.
Major Export Countries / Regions for Chinese Organic Chemicals, from Jan. to Dec. 2014 (by Export Value)
| No. | Countries/Regions | Grand Total from Jan. to Dec. | Total Compared to the Same Period of 2013 | ||
| Volume(KG) | Value(USD) | Volume | Value | ||
| 1 | India | 1,412,401,953 | 6,240,751,465 | 42% | 19.2% |
| 2 | USA | 1,184,798,080 | 6,157,071,030 | -5.1% | -2.6% |
| 3 | Japan | 857,853,521 | 2,977,997,329 | -3.4% | 4% |
| 4 | Korea | 1,015,248,725 | 2,511,947,577 | -22.4% | 0.4% |
| 5 | Netherlands | 430,353,936 | 1,908,153,904 | 17.5% | 7.7% |
| 6 | Germany | 339,907,997 | 1,880,895,674 | 15.2% | 7.7% |
| 7 | Brazil | 424,569,828 | 1,880,562,232 | 2.3% | -1.1% |
| 8 | Taiwan | 658,842,973 | 1,452,669,510 | -1.8% | 0.4% |
| 9 | Belgium | 263,682,325 | 1,226,141,765 | 6.1% | 16.5% |
| 10 | Indonesia | 562,563,656 | 1,084,941,385 | 35.9% | 8.9% |
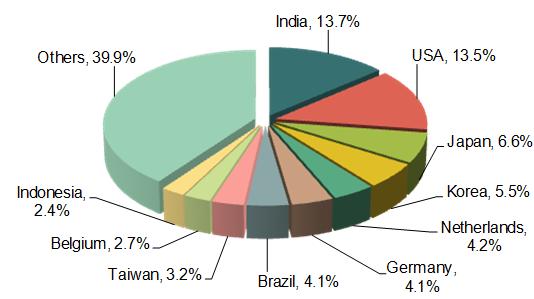
From Jan. to Dec.2014, the major export countries and regions for Chinese Organic Chemicals were India, USA, Japan, Korea, Netherlands, Germany, Brazil, Taiwan, Belgium, and Indonesia and so on. India and USA were the major export markets, the export value to them accounted for 13.7% and 13.5% of the total.
Major Export Countries / Regions for Chinese Fertilizer, from Jan. to Dec. 2014 (by Export Value)
| No. | Countries/Regions | Grand total from Jan. to Dec. | Total Compared to the Same Period of 2013 | ||
| Volume(KG) | Value(USD) | Volume | Value | ||
| 1 | India | 7,285,223,362 | 2,339,083,967 | 38.5% | 22.4% |
| 2 | USA | 1,942,036,793 | 622,414,104 | 214.5% | 212.2% |
| 3 | Brazil | 1,712,383,909 | 565,642,523 | 38.7% | 45.9% |
| 4 | Pakistan | 1,356,260,672 | 509,737,387 | 61% | 64.7% |
| 5 | Vietnam | 1,759,283,900 | 508,513,500 | -10.1% | -11.1% |
| 6 | Indonesia | 1,452,369,814 | 342,611,083 | 50.7% | 33.1% |
| 7 | The Philippines | 1,276,991,025 | 323,641,118 | 43.8% | 27.4% |
| 8 | Mexico | 1,119,579,342 | 321,212,255 | 73.5% | 75.5% |
| 9 | Australia | 847,503,414 | 269,409,761 | 130.5% | 127% |
| 10 | Thailand | 758,806,840 | 240,025,696 | 46.6% | 45.1% |
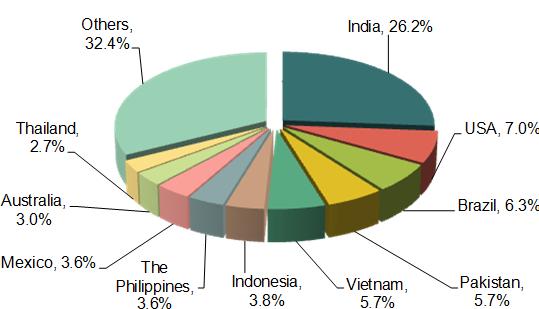
From Jan. to Dec.2014, the major export countries and regions for Chinese Fertilizer were India, USA, Brazil, Pakistan, Vietnam, Indonesia, The Philippines, Mexico, Australia, and Thailand and so on. India was the major export market of Chinese Fertilizer, the export value to it accounted for 26.2% of the total. Among the first ten export markets of Chinese Fertilizer, the export value to USA and Australia increased 212.2% and 127%, which increased fast, only the exports to Vietnam declined.
Major Export Countries / Regions for Chinese Miscellaneous Chemical Products, from Jan. to Dec. 2014 (by Export Value)
| No. | Countries/Regions | Grand Total from Jan. to Dec. | Total Compared to the Same Period of 2013 | ||
| Volume(KG) | Value(USD) | Volume | Value | ||
| 1 | Taiwan | 470,495,857 | 1,836,574,266 | 84.3% | 29.2% |
| 2 | Korea | 862,224,060 | 1,088,673,773 | 25.2% | 22.9% |
| 3 | USA | 406,309,573 | 1,043,515,075 | 6% | 17.9% |
| 4 | Japan | 1,350,391,597 | 1,018,439,028 | 6.5% | 6.5% |
| 5 | Thailand | 382,245,539 | 617,410,572 | 5.5% | 1.1% |
| 6 | Malaysia | 275,157,107 | 547,141,527 | 13.2% | 10.8% |
| 7 | Indonesia | 423,279,457 | 525,013,215 | 14.2% | 10% |
| 8 | Hong Kong | 216,852,993 | 456,477,351 | 12.7% | 17.4% |
| 9 | Vietnam | 278,668,547 | 428,905,712 | 8.9% | 22.3% |
| 10 | The Philippines | 176,739,819 | 414,218,532 | 10.9% | 19.2% |
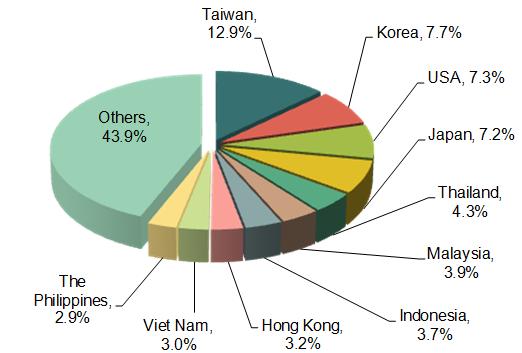
From Jan. to Dec.2014, the major export countries and regions for Chinese Miscellaneous Chemical Products were Taiwan, Korea, USA, Japan, Thailand, Malaysia, Indonesia, Hong Kong, Vietnam, and The Philippines and so on. Taiwan was the major export market of Chinese Miscellaneous Chemical Products, the export value to it accounted for 12.9% of the total.
Major Export Countries / Regions for Chinese Plastics and Articles Thereof, from Jan. to Dec. 2014 (by Export Value)
| No. | Countries/Regions | Grand Total from Jan. to Dec. | Total Compared to the Same Period of 2013 | ||
| Volume(KG) | Value(USD) | Volume | Value | ||
| 1 | USA | 3,818,228,938 | 12,745,293,082 | 11% | 4.8% |
| 2 | Hong Kong | 1,256,161,335 | 5,102,355,045 | -5.8% | -5.8% |
| 3 | Japan | 1,386,948,283 | 4,387,086,534 | 5.2% | 2.9% |
| 4 | India | 984,746,793 | 2,237,935,915 | 45.9% | 24.9% |
| 5 | Russian Federation | 824,164,808 | 1,971,626,936 | 25% | 27% |
| 6 | Korea | 559,381,143 | 1,786,259,076 | 7.9% | 13% |
| 7 | Malaysia | 550,046,175 | 1,683,229,426 | 19.9% | 7.8% |
| 8 | United States | 426,991,024 | 1,661,873,251 | 11.1% | 5.8% |
| 9 | Germany | 410,347,880 | 1,597,837,811 | 13.7% | 5.7% |
| 10 | Australia | 481,679,988 | 1,586,904,121 | 11.6% | 8.2% |
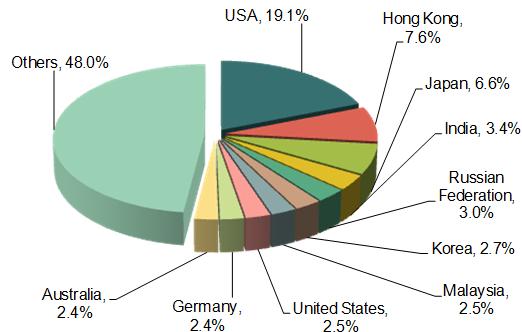
From Jan. to Dec.2014, the major export countries and regions for Chinese Plastics and articles thereof were USA, Hong Kong, Japan, India, Russian Federation, Korea, Malaysia, United States, Germany, and Australia and so on. Germany and Australia were the major export market of Chinese Plastics and articles thereof, the export value to USA accounted for 19.1% of the total.
Major Export Countries / Regions for Chinese Rubber and Articles Thereof, from Jan. to Dec. 2014 (by Export Value)
| No. | Countries/Regions | Grand Total from Jan. to Dec. | Total Compared to the Same Period of 2013 | ||
| Volume(KG) | Value(USD) | Volume | Value | ||
| 1 | USA | 1,593,228,392 | 5,188,919,876 | 15.4% | 5.6% |
| 2 | United States | 263,959,207 | 858,079,583 | 8.5% | -0.7% |
| 3 | Mexico | 246,465,214 | 735,366,917 | 33.4% | 20.4% |
| 4 | Japan | 135,775,446 | 709,481,109 | 10.4% | 7.3% |
| 5 | Russian Federation | 234,986,920 | 672,947,576 | -4.9% | -12.4% |
| 6 | UAE | 243,113,304 | 658,551,081 | 11.7% | -0.8% |
| 7 | Australia | 200,631,538 | 652,121,929 | 3% | -7.2% |
| 8 | Germany | 151,857,751 | 616,595,581 | 24.8% | 19.9% |
| 9 | Saudi Arabia | 205,173,441 | 531,821,701 | -4.9% | -13.1% |
| 10 | Canada | 163,382,349 | 525,865,997 | 7.4% | -2.5% |
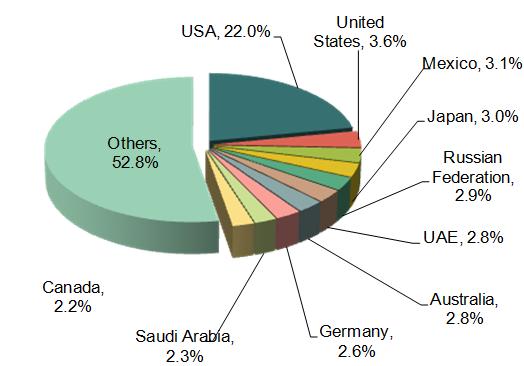
From Jan. to Dec.2014, the major export countries and regions for Chinese Rubber and articles thereof were USA, United States, Mexico, Japan, Russian Federation, UAE, Australia, Germany, Saudi Arabia, and Canada and so on. USA is the major export market of Chinese Plastics and articles thereof, the export value to USA accounted for 22% of the total.


