2010-2012 Global Battery Import Value Trend
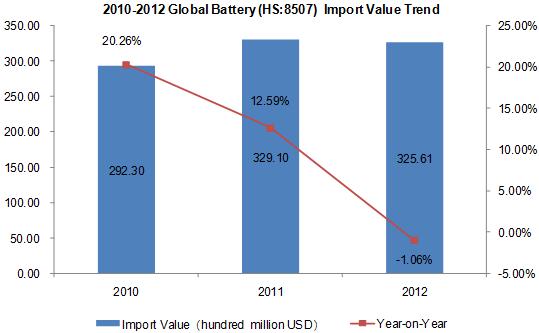
2010-2012 total global battery import value battery inverted "V"-shaped trend, the total import value of the three years was $ 29.23 billion (down 20.26%), $ 32.91 billion (an increase of 12.59%) and $ 32.561 billion (down 1.06%).
2010-2012 Global Battery Main Import Country/Region
| No. | Import Country/Region | Import Value (Thousand USD) | Import Value Growth Compared 2012 with 2010 | ||
| 2010 | 2011 | 2012 | |||
| 1 | China | 5,723,711 | 5,562,231 | 4,997,291 | -12.69% |
| 2 | USA | 3,083,690 | 3,411,306 | 3,874,757 | 25.65% |
| 3 | Germany | 1,602,247 | 2,129,692 | 2,111,032 | 31.75% |
| 4 | Hong Kong | 2,058,777 | 2,006,156 | 2,067,779 | 0.44% |
| 5 | France | 1,027,222 | 1,270,113 | 1,386,507 | 34.98% |
| 6 | Japan | 885,453 | 1,035,176 | 1,144,385 | 29.24% |
| 7 | Canada | 715,117 | 875,318 | 881,716 | 23.30% |
| 8 | United Kingdom | 782,113 | 893,839 | 804,351 | 2.84% |
| 9 | Mexico | 821,447 | 847,254 | 794,996 | -3.22% |
| 10 | Republic of Korea | 736,857 | 759,244 | 753,892 | 2.31% |
| 11 | Russian Federation | 549,313 | 705,277 | 702,208 | 27.83% |
| 12 | Italy | 711,130 | 774,886 | 679,309 | -4.47% |
| 13 | Netherlands | 531,058 | 620,837 | 672,101 | 26.56% |
| 14 | Vietnam | 99,175 | 296,945 | 518,648 | 422.96% |
| 15 | Chinese Taipei | 498,915 | 537,141 | 505,946 | 1.41% |
| 16 | India | 330,735 | 578,736 | 502,018 | 51.79% |
| 17 | Brazil | 422,586 | 489,716 | 496,106 | 17.40% |
| 18 | Australia | 374,603 | 465,533 | 489,558 | 30.69% |
| 19 | Belgium | 505,261 | 602,198 | 488,232 | -3.37% |
| 20 | United Arab Emirates | 370,963 | 475,600 | 447,314 | 20.58% |
2010-2012, China, the USA and Germany were the world's top three battery import countries. Among the 2012 world's first 20 largest battery import markets, the import value of Vietnam increased by 422.96% over 2010, the highest increase.
2010-2012 Global Battery Main import Country/ Region Market Proportion
| No. | Import Country/Region | Import Value Percentage | ||
| 2010 | 2011 | 2012 | ||
| 1 | China↓ | 19.58% | 16.90% | 15.35% |
| 2 | USA | 10.55% | 10.37% | 11.90% |
| 3 | Germany↑ | 5.48% | 6.47% | 6.48% |
| 4 | Hong Kong | 7.04% | 6.10% | 6.35% |
| 5 | France↑ | 3.51% | 3.86% | 4.26% |
| 6 | Japan↑ | 3.03% | 3.15% | 3.51% |
| 7 | Canada↑ | 2.45% | 2.66% | 2.71% |
| 8 | United Kingdom | 2.68% | 2.72% | 2.47% |
| 9 | Mexico↓ | 2.81% | 2.57% | 2.44% |
| 10 | Republic of Korea | 2.52% | 2.31% | 2.32% |
| 11 | Russian Federation↑ | 1.88% | 2.14% | 2.16% |
| 12 | Italy↓ | 2.43% | 2.35% | 2.09% |
| 13 | Netherlands↑ | 1.82% | 1.89% | 2.06% |
| 14 | Vietnam↑ | 0.34% | 0.90% | 1.59% |
| 15 | Chinese Taipei↓ | 1.71% | 1.63% | 1.55% |
| 16 | India | 1.13% | 1.76% | 1.54% |
| 17 | Brazil↑ | 1.45% | 1.49% | 1.52% |
| 18 | Australia↑ | 1.28% | 1.41% | 1.50% |
| 19 | Belgium | 1.73% | 1.83% | 1.50% |
| 20 | United Arab Emirates | 1.27% | 1.45% | 1.37% |
Note: “↑”represents that the indicators listed, continued to increase from 2010 to 2012, “↓”represents that the indicators listed, continued to decrease from 2010 to 2012.
From the market proportion in 2010-2012, we can see that the import value proportion of Germany, France, Japan, Canada, Russian Federation, Netherlands, Vietnam, Brazil and Australia continued to rise; the country which continued to decline includes China, Mexico, Italy and Chinese Taipei.
Global Battery Major Import Countries, from Jan. to Jun. 2013
| No. | Main Import Country/Region | Import Value from Jan. to Jun.2013(Thousand USD) | Compared to the same period last year |
| 1 | USA | 2,053,466 | 12.56% |
| 2 | China | 1,962,342 | -18.67% |
| 3 | Germany | 1,037,108 | 0.31% |
| 4 | France | 806,684 | 6.59% |
| 5 | Japan | 542,525 | 1.99% |
| 6 | Canada | 475,107 | 11.69% |
| 7 | United Kingdom | 457,896 | 15.63% |
| 8 | Mexico | 440,654 | 18.83% |
| 9 | Republic of Korea | 369,639 | -4.54% |
| 10 | Italy | 362,357 | 2.28% |
| 11 | Netherlands | 316,153 | -8.99% |
| 12 | Russian Federation | 281,176 | 4.54% |
| 13 | Brazil | 254,838 | 8.29% |
| 14 | India | 243,130 | -3.16% |
| 15 | Australia | 238,644 | 0.90% |
| 16 | Poland | 237,361 | 27.68% |
| 17 | Chinese Taipei | 236,911 | 6.65% |
| 18 | Singapore | 227,345 | 10.73% |
| 19 | Belgium | 227,185 | -10.04% |
| 20 | Spain | 201,091 | -13.16% |
From Jan. to Jun.2013,the above twenty battery import markets, the United States, China and Germany were among the top three, import value respectively amounted to $ 2.053 billion (an increase of 12.56%), $ 1.962 billion (down by 18.67 %), $ 1.037 billion (an increase of 0.31%).


