Jan. - Dec. 2014 China Chandeliers Export Volume and Value
| Month | Volume(unit) | Value(USD) | Compared to the same period last year | |
| Volume | Value | |||
| Jan. | 85,023,369 | 956,354,651 | 101% | 221.7% |
| Feb. | 26,686,160 | 268,810,510 | -9.8% | 41.7% |
| Mar. | 46,142,470 | 391,034,867 | 77% | 107.3% |
| Apr. | 68,513,266 | 573,923,134 | 96.9% | 121.4% |
| May | 76,421,611 | 681,051,216 | 81.8% | 156.4% |
| Jun. | 67,235,450 | 629,833,783 | 63% | 153.6% |
| Jul. | 80,042,385 | 817,717,422 | 82.1% | 188.8% |
| Aug. | 74,359,348 | 817,408,020 | 52.5% | 121.8% |
| Sep. | 71,338,066 | 792,987,681 | 18.1% | 34.1% |
| Oct. | 69,727,374 | 673,157,762 | 2.3% | -13% |
| Nov. | 72,672,419 | 682,925,871 | 9.1% | -16.2% |
| Dec. | 81,262,457 | 856,232,623 | 15.2% | 1.3% |
| Jan. - Dec. Total | 819,424,375 | 8,141,437,540 | 42.6% | 58.8% |
The China's Chandeliers export volume from Jan. to Dec. 2014 amounted to 819 units, an increase of 42.6% compared to the same period of last year. The export value amounted to 8.141 billion US dollars, an increase of 58.8% compared to the same period last year.
Jan. - Dec. 2014 China Chandeliers' Distribution of Major Export Countries/Regions
| NO. | Countries | Volume(unit) | Value(USD) | Compared to the same period last year | |
| Volume | Value | ||||
| 1 | USA | 111,137,078 | 1,273,635,924 | 12.5% | 21.9% |
| 2 | Malaysia | 45,462,604 | 648,216,081 | 105.6% | 116.5% |
| 3 | Singapore | 52,563,556 | 573,965,776 | 663.5% | 393.5% |
| 4 | Germany | 40,470,728 | 402,310,560 | 19.8% | 21% |
| 5 | Iran | 29,140,653 | 385,208,063 | 401.2% | 217.8% |
| 6 | United Arab Emirates | 35,193,210 | 296,713,276 | 69.5% | 100.6% |
| 7 | Indonesia | 21,708,264 | 277,130,743 | 51.6% | 72.5% |
| 8 | Russian Federation | 35,948,380 | 256,628,077 | 30.7% | 92.8% |
| 9 | Japan | 11,657,729 | 251,107,881 | 14% | 2.2% |
| 10 | India | 27,959,953 | 246,280,461 | 116.5% | 164.3% |
| 11 | Netherlands | 17,899,889 | 234,541,033 | 18.8% | 20.8% |
| 12 | United Kingdom | 24,770,176 | 230,291,208 | 26.1% | 31.1% |
| 13 | Canada | 15,348,062 | 203,297,971 | 24.7% | 30.2% |
| 14 | Viet Nam | 9,934,142 | 186,255,087 | 313% | 263.2% |
| 15 | France | 15,365,620 | 135,233,857 | 16.1% | 39.3% |
| 16 | Saudi Arabia | 20,980,091 | 132,718,964 | 32.3% | 45.2% |
| 17 | Australia | 10,694,047 | 129,867,131 | 30.8% | 39.3% |
| 18 | Hong Kong | 14,501,271 | 121,778,298 | 36.2% | 17.5% |
| 19 | Spanish | 12,935,818 | 112,481,607 | 18.7% | 24.4% |
| 20 | Poland | 13,842,770 | 106,267,013 | 30.4% | 57.8% |
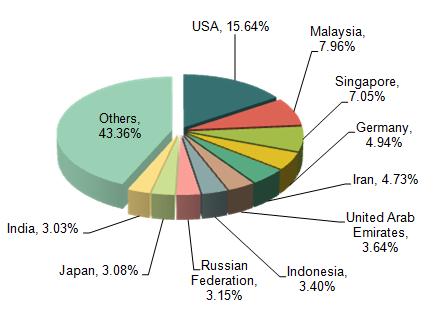
The export data from Jan. to Dec. in 2014 shows, major export markets of China's Chandeliers are USA, Malaysia, Singapore, Germany, Iran, United Arab Emirates, Indonesia, Russian Federation, Japan and India.
USA, Malaysia and Singapore are the three biggest export markets of China's Chandeliers, accounting for 15.64%, 7.96% and 7.05% in total.
From Jan. to Dec. in 2014, among the 20 biggest Chandeliers export markets, the export value to Singapore increased fastest, an increase of 393.5% compared to the same period in 2013.
Jan. to Dec. 2014 China Chandeliers' Original Export Place
| NO. | Regions | Volume(unit) | Value(USD) | Compared to the same period last year | |
| Volume | Value | ||||
| 1 | Guangdong | 680,973,755 | 6,960,860,954 | 47.1% | 66.7% |
| 2 | Zhejiang | 70,113,010 | 320,605,196 | 22.2% | 21.3% |
| 3 | Jiangsu | 23,712,775 | 167,009,165 | 14.6% | 9.9% |
| 4 | Liaoning | 5,197,703 | 146,027,720 | 39.4% | 14.3% |
| 5 | Shanghai | 10,059,251 | 131,239,880 | -10.7% | 4.1% |
| 6 | Fujian | 8,753,505 | 87,768,415 | 68.9% | 126.5% |
| 7 | Xinjiang | 1,942,497 | 44,289,435 | 90.5% | 63% |
| 8 | Heilongjiang | 1,998,455 | 35,979,276 | 560.4% | 679.8% |
| 9 | Shaanxi | 2,702,472 | 34,879,941 | 170.7% | 49.6% |
| 10 | Jiangxi | 1,721,103 | 32,872,018 | 73.6% | 127.2% |
Guangdong is Chinese main original exports place of chandeliers. From January to November in 2014, the exports amount of chandeliers in Guangdong accounts for 83.1%, while its exports volume accounts for 85.5% in total.
From January to December in 2014, among the first 10 top exports original places of chandeliers, the exports volume of Heilongjiang increases by 679.8%, compared to the same period last year at the fastest speed. The second is Jiangxi, increasing by 127.2%.
Jan. to Dec. 2014 China Table, Desk, Bedside or Floorstanding Lamps Exports Volume and Value
| Month | Volume(pcs) | Value(USD) | Compared to the same period last year | |
| Volume | Value | |||
| Jan. | 18,940,450 | 319,063,235 | 76% | 313.1% |
| Feb. | 8,089,849 | 117,277,549 | 9.1% | 127.9% |
| Mar. | 13,618,984 | 116,822,183 | 69.3% | 109.1% |
| Apr. | 20,071,456 | 185,040,137 | 83.2% | 154.6% |
| May | 21,108,760 | 209,635,576 | 48% | 136.8% |
| Jun. | 21,810,707 | 245,398,136 | 57.2% | 196.1% |
| Jul. | 22,382,876 | 347,513,128 | 64.1% | 290.7% |
| Aug. | 21,242,480 | 373,592,836 | 40.7% | 180.3% |
| Sep. | 20,613,021 | 351,949,684 | 14.4% | 51.6% |
| Oct. | 29,529,996 | 292,373,086 | 46.2% | -12.3% |
| Nov. | 20,865,263 | 332,169,676 | 5.7% | -10.4% |
| Dec. | 20,569,800 | 350,581,028 | 2.2% | / |
| Jan. - Dec. | 238,843,642 | 3,241,416,254 | 38.8% | 67.3% |
From January to December in 2014, Chinese table, desk, bedside or floorstanding lamps exports amount is 239 million, increasing by 38.8%, compared to the same period last year; its exports value is 3.241 billion dollars, increasing by 67.3%, compared to the same period last year.
Jan. to Dec. 2014 China Table, Desk, Bedside or Floorstanding Lamps Exports Major Export Countries/Regions Distribution
| NO. | Countries | Volume(pcs) | Value(USD) | Compared to the same period last year | |
| Volume | Value | ||||
| 1 | USA | 53,318,968 | 921,034,650 | 6.3% | 30% |
| 2 | Iran | 7,963,530 | 258,499,775 | 278.9% | 241% |
| 3 | Germany | 17,295,400 | 196,076,467 | 15.8% | 22.7% |
| 4 | United Kingdom | 12,830,531 | 192,130,944 | 17.4% | 40.6% |
| 5 | Netherlands | 7,387,602 | 177,496,813 | 44.5% | 113.1% |
| 6 | Russian Federation | 7,830,849 | 128,831,244 | 43.6% | 404.1% |
| 7 | United Arab Emirates | 5,167,960 | 125,339,274 | 178.9% | 452.6% |
| 8 | Canada | 5,456,334 | 111,869,344 | 12.3% | 23.4% |
| 9 | Singapore | 4,313,954 | 89,814,619 | 332.2% | 266.9% |
| 10 | Malaysia | 5,000,903 | 88,450,588 | 184.4% | 177.9% |
| 11 | France | 7,085,372 | 74,104,720 | 15.2% | 38.4% |
| 12 | Indonesia | 3,711,242 | 59,906,476 | 292% | 496% |
| 13 | Australia | 14,292,742 | 53,029,205 | 345.5% | 46.1% |
| 14 | Korea | 1,636,810 | 51,128,591 | 122.6% | 308.3% |
| 15 | India | 9,367,199 | 45,732,447 | 84.1% | 113.5% |
| 16 | Spanish | 3,991,297 | 41,501,949 | 10.2% | 18.4% |
| 17 | Japan | 3,823,586 | 39,146,912 | 2.1% | -8.7% |
| 18 | Italy | 4,023,977 | 35,504,397 | 4.4% | 34.3% |
| 19 | Belgium | 3,562,716 | 33,915,565 | -4.7% | 6.4% |
| 20 | Saudi Arabia | 1,676,533 | 33,450,493 | 91.9% | 166% |
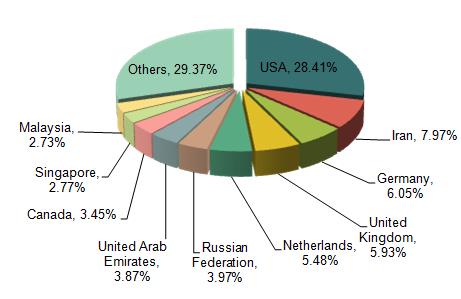
According to the exports data from January to December in 2014, Chinese table, desk, bedside or floorstanding lamps' major export markets are USA, Iran, Germany, United Kingdom, Netherlands, Russian Federation, United Arab Emirates, Canada, Singapore and Malaysia etc.
USA, Iran and Germany are the first three biggest export market, accounting for 28.41%, 7.97% and 6.05% of total of the product's export value.
From January to December in 2014, among the first 20 biggest export markets in China, the export value to Indonesia increases by 496% at the fastest speed.
Jan. to Dec. 2014 Major Original Export Places of Chinese Able, Desk, Bedside or Floorstanding Lamps
| NO. | region | Volume(pcs)) | Value(USD) | Compared to the same period last year | |
| Volume | Value | ||||
| 1 | Guangdong | 154,863,548 | 2,625,984,376 | 39.4% | 73.9% |
| 2 | Zhejiang | 64,488,424 | 260,843,022 | 42% | 25.9% |
| 3 | Fujian | 5,598,121 | 66,838,504 | 8.9% | 66.9% |
| 4 | Hebei | 150,264 | 31,829,478 | 576.4% | 4681.4% |
| 5 | Shanghai | 2,867,575 | 28,689,627 | -19% | -11.6% |
| 6 | Jiangsu | 3,467,303 | 27,735,683 | 7.9% | -18.1% |
| 7 | Heilongjiang | 538,676 | 26,534,803 | 1775.9% | 6210.5% |
| 8 | Inner Mongolia Autonomous Region | 360,563 | 17,330,172 | 901307.5% | 8932978% |
| 9 | Sichuan | 807,834 | 16,920,091 | 11.1% | 136.9% |
| 10 | Liaoning | 664,309 | 16,632,850 | 54% | 6.7% |
Guangdong and Zhejiang are the major export original places of table, desk, bedside or floorstanding lamps, accounting for 91.84% of the product export amount in China. Its export value accounts for 89.06%.
From January to December in 2014, among the first 10 export original places of table, desk, bedside or floorstanding lamps increases by 8932978% at the fastest speed, followed by Heilongjiang, increasing by 6210.5%.
Jan. to Dec. 2014 Lighting Sets of a Kind Used for Christmas Trees' Export Volume and Value
| Month | Volume(set) | Value(USD) | Compared to the same period last year | |
| Volume | Value | |||
| Jan. | 8,812,807 | 16,511,649 | 117.1% | 31.2% |
| Feb. | 3,384,569 | 8,838,655 | 13% | 5.9% |
| Mar. | 5,453,242 | 15,077,439 | 28.2% | 40.2% |
| Apr. | 13,845,989 | 27,238,804 | 67.2% | 40.5% |
| May | 23,800,594 | 47,382,242 | 30.5% | 14.7% |
| Jun. | 59,109,851 | 105,862,236 | 68.8% | 28.7% |
| Jul. | 133,266,461 | 307,558,686 | 57% | 40.8% |
| Aug. | 200,753,399 | 514,986,462 | 24.3% | 15.1% |
| Sep. | 145,747,998 | 391,022,054 | -12.1% | -3% |
| Oct. | 66,094,504 | 175,954,647 | -10.2% | -6.5% |
| Nov. | 18,093,439 | 37,087,999 | 7.9% | 18.6% |
| Dec. | 11,315,115 | 24,335,921 | 1.4% | 21.4% |
| Jan.-Dec. | 689,677,968 | 1,671,856,794 | 17.6% | 12.7% |
From January to December in 2014, the export volume of lighting sets of a kind used for Christmas trees accounts for 690 million sets, increasing by 17.6% compared to the same period last year. Its export value accounts for 1.672 billion dollars, increasing by 12.7% compared to the same period last year.
Jan. to Dec. 2014 Distribution of Lighting Sets of a Kind Used for Christmas Trees Export Countries/Regions
| NO. | Countries | Volume(set) | Value(USD) | Compared to the same period last year | |
| Volume | Value | ||||
| 1 | USA | 202,850,472 | 552,607,939 | -0.9% | -4.2% |
| 2 | United Kingdom | 27,124,963 | 109,449,332 | 28.3% | 12.2% |
| 3 | Germany | 32,404,374 | 105,602,506 | 13% | 4.1% |
| 4 | Netherlands | 27,626,114 | 97,447,918 | 25.1% | 18.8% |
| 5 | India | 147,332,063 | 93,536,451 | 111% | 160.6% |
| 6 | Russian Federation | 22,014,325 | 68,774,409 | 56.2% | 112% |
| 7 | Mexico | 25,973,401 | 67,743,103 | -6.2% | 0.5% |
| 8 | Australia | 9,170,190 | 54,327,743 | 58.4% | 44.3% |
| 9 | Canada | 13,825,928 | 48,132,830 | 0.1% | -5.4% |
| 10 | Brazil | 19,576,957 | 37,358,153 | -55.1% | -17.6% |
| 11 | Sweden | 7,675,580 | 33,241,158 | 25.1% | 21.4% |
| 12 | Italy | 7,442,943 | 32,775,345 | 13.4% | 10.4% |
| 13 | Colombia | 16,628,268 | 29,413,256 | 77.5% | 63.6% |
| 14 | France | 5,657,082 | 26,373,895 | 14.6% | 3.2% |
| 15 | Belgium | 4,737,843 | 23,387,277 | 45.5% | 27.3% |
| 16 | Poland | 7,283,747 | 20,473,609 | 71.7% | 78.6% |
| 17 | Spanish | 5,557,740 | 16,762,387 | 249.8% | 140.3% |
| 18 | Chile | 5,087,925 | 14,468,249 | 1.2% | 7% |
| 19 | Japan | 1,478,234 | 12,938,113 | 10.7% | 2.4% |
| 20 | Denmark | 3,094,554 | 11,256,948 | 16.8% | 5.7% |
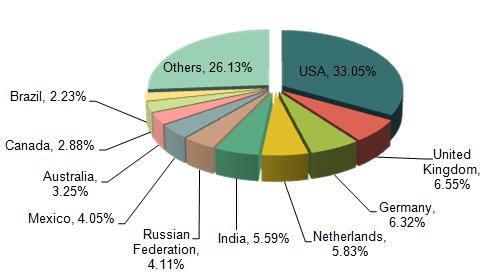
According to the exports data from January to December in 2014, Chinese Lighting sets of a kind used for Christmas trees' major export markets are USA, United Kingdom, Germany, Netherlands, India, Russian Federation, Mexico, Australia, Canada and Brazil etc.
USA, United Kingdom and Germany are the first three biggest export markets of lighting sets of a kind used for Christmas trees, accounting for 33.05%, 6.55% and 6.32% of the total export volume.
From January to December in 2014, among the 20 biggest lighting sets of a kind used for Christmas trees export markets, the Indian market increased by 160.6% at the fastest speed compared to the same period of 2013.
Jan. to Dec. 2014 China Lighting Sets of a Kind Used for Christmas Trees' Export Original Place
| NO. | region | Volume(set) | Value(USD) | Compared to the same period last year | |
| Volume | Value | ||||
| 1 | Zhejiang | 454,605,042 | 979,267,876 | 26.1% | 23.8% |
| 2 | Guangdong | 190,025,318 | 513,369,943 | 0.2% | -4.6% |
| 3 | Jiangxi | 9,463,560 | 34,735,284 | 17.2% | 10.5% |
| 4 | Jiangsu | 5,263,438 | 34,063,068 | -38.2% | -31% |
| 5 | Anhui | 7,782,993 | 23,862,874 | -6.4% | 52.6% |
| 6 | Heilongjiang | 3,054,913 | 22,089,912 | 108% | 121.7% |
| 7 | Fujian | 9,674,390 | 20,798,165 | 204.3% | 42.4% |
| 8 | Shandong | 3,110,934 | 17,740,233 | 145.4% | 89.4% |
| 9 | Shanghai | 3,075,950 | 13,344,945 | 7.1% | 36.8% |
| 10 | Hubei | 1,925,374 | 5,498,646 | 33.2% | 37.3% |
Zhejiang and Guangdong are the major export original places of lighting sets of a kind used for Christmas trees. From January to December in 2014, the two provinces' export volume accounts for 93.47% of the total export volume, its export value accounts for 89.28% of the total value.
From January to December in 2014, among the first 10 lighting sets of a kind used for Christmas trees, the lighting sets of a kind used for Christmas trees' export volume of Heilongjiang increased by 121.7% at the fastest speed.
Jan. to Dec. 2014 China Other Lamps and Lighting Fittings' Export Volume and Value
| Month | Volume(-) | Value(USD) | Compared to the same period last year | |
| Volume | Value | |||
| Jan. | 92,496,545 | 1,291,183,227 | 71.5% | 101.7% |
| Feb. | 41,347,603 | 585,590,288 | 7.1% | 23.5% |
| Mar. | 64,368,135 | 895,087,693 | 60.1% | 76.2% |
| Apr. | 82,691,259 | 1,140,954,345 | 75.2% | 87.5% |
| May | 83,859,831 | 1,175,571,171 | 79.9% | 84.8% |
| Jun. | 82,324,311 | 1,152,514,950 | 89.6% | 88.8% |
| Jul. | 100,447,646 | 1,394,717,765 | 94.4% | 96.5% |
| Aug. | 99,954,930 | 1,426,491,489 | 63.9% | 78% |
| Sep. | 94,344,719 | 1,356,964,688 | 37.6% | 53.2% |
| Oct. | 89,126,215 | 1,242,692,062 | 35.9% | 34.8% |
| Nov. | 95,236,213 | 1,329,956,798 | 31% | 24.4% |
| Dec. | 105,816,542 | 1,467,159,192 | 29.2% | 22.6% |
| Jan.-Dec. | 1,032,013,949 | 14,458,883,668 | 53.7% | 59.6% |
From January to December in 2014, Chinese other lamps and lighting fittings export value accounts for 14.459 billion dollars, increasing by 59.6% compared to the same period last year.
Jan. to Dec. 2014 Distribution of Chinese Other Lamps and Lighting Fittings' Major Export Countries and Regions
| NO. | Countries | Volume(-) | Value(USD) | Compared to the same period last year | |
| Volume | Value | ||||
| 1 | USA | 218,257,365 | 2,922,653,867 | 23% | 41.3% |
| 2 | Russian Federation | 44,889,060 | 1,047,750,037 | 91.8% | 215.4% |
| 3 | Germany | 54,603,546 | 960,853,089 | 36.6% | 30.7% |
| 4 | Japan | 20,053,152 | 624,377,141 | 15.6% | 1.5% |
| 5 | United Kingdom | 47,078,806 | 595,419,137 | 49.5% | 52.7% |
| 6 | Hong Kong | 49,288,504 | 529,915,174 | 128.6% | 47.2% |
| 7 | Netherlands | 32,348,220 | 466,475,508 | 52.4% | 48.9% |
| 8 | France | 24,830,643 | 384,259,193 | 27.5% | 37.3% |
| 9 | Australia | 23,011,910 | 352,588,414 | 23.9% | 34.9% |
| 10 | Spanish | 21,213,672 | 350,128,255 | 80.1% | 86% |
| 11 | Italy | 16,843,779 | 322,339,028 | 52% | 57.4% |
| 12 | Canada | 24,002,066 | 311,043,326 | 16.3% | 36.9% |
| 13 | Singapore | 24,839,685 | 300,340,191 | 291.9% | 215.1% |
| 14 | Malaysia | 22,014,376 | 298,927,845 | 128.1% | 145% |
| 15 | United Arab Emirates | 27,967,991 | 294,740,046 | 105.8% | 125% |
| 16 | Korea | 12,119,977 | 267,026,118 | 96.3% | 78.2% |
| 17 | India | 23,021,721 | 266,073,164 | 138.8% | 152.6% |
| 18 | Iran | 21,627,528 | 233,226,088 | 369.4% | 238.5% |
| 19 | Indonesia | 14,347,134 | 230,160,286 | 69.5% | 72.7% |
| 20 | Poland | 14,635,598 | 213,510,053 | 57.1% | 59.3% |
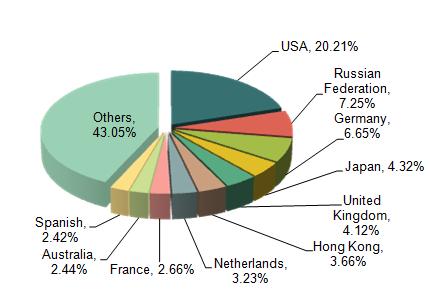
According to the exports data from January to December in 2014, Chinese other lamps and lighting fittings major export markets are USA, Russian Federation, Germany, Japan, United Kingdom, Hong Kong, Netherlands, France, Australia and Spanish etc.
USA, Russian Federation and Germany are the first three biggest export markets. The export value of the three countries accounts for 20.21%, 7.25% and 6.65% of the total.
From January to December in 2014, among the first 20 Chinese other lamps and lighting fittings, the export to Iran increased by 238.5% at the fastest speed, compare to the same period last year.
Jan. to Dec. 2014 China Other Lamps and Lighting Fittings' Export Original Places
| NO. | region | Volume(-) | Value(USD) | Compared to the same period last year | |
| Volume | Value | ||||
| 1 | Guangdong | 442,461,174 | 6,734,566,021 | 76.8% | 69.7% |
| 2 | Zhejiang | 365,698,698 | 3,504,580,145 | 37% | 43.6% |
| 3 | Fujian | 62,979,878 | 1,320,392,011 | 42.5% | 51.8% |
| 4 | Jiangsu | 59,078,558 | 864,903,670 | 33.1% | 27.9% |
| 5 | Shanghai | 41,208,672 | 704,263,096 | 14.5% | 21.4% |
| 6 | Heilongjiang | 10,791,852 | 566,166,925 | 679.6% | 649.2% |
| 7 | Sichuan | 6,003,704 | 132,172,643 | 197.5% | 200.6% |
| 8 | Jiangxi | 7,167,186 | 109,354,341 | 200.7% | 169.8% |
| 9 | Anhui | 6,118,601 | 88,920,041 | 105.6% | 104% |
| 10 | Liaoning | 2,729,780 | 61,878,860 | -7.6% | -33.2% |
Guangdong, Zhejiang and Fujian are the major export original places of Chinese other lamps and lighting fittings. From January to December in 2014, the three provinces' export volume accounts for 84.41%, its export volume accounts for 79.95% of the total.
From January to December in 2014, the export volume of other lamps and lighting fittings increased by 649.2% at the fastest speed ,compared to the same period last year.
Jan. to Dec. 2014 China Nonelectrical Lamps and Lighting Fittings' Export Volume and Value
| Month | Volume(kg) | Value(USD) | Compared to the same period last year | |
| Volume | Value | |||
| Jan. | 15,189,424 | 72,767,328 | -10.9% | -11.2% |
| Feb. | 7,821,613 | 33,945,881 | -29.2% | -39.4% |
| Mar. | 9,832,790 | 36,950,033 | -2.4% | -22.4% |
| Apr. | 11,648,554 | 45,453,467 | -6.5% | -23.1% |
| May | 12,906,815 | 56,595,474 | -2.7% | -14.6% |
| Jun. | 15,166,307 | 67,297,204 | 1.9% | -18.1% |
| Jul. | 19,434,666 | 96,310,153 | 7.2% | -13.6% |
| Aug. | 19,583,370 | 105,336,814 | 0.3% | 0.5% |
| Sep. | 17,056,931 | 92,408,119 | 1.3% | 3.8% |
| Oct. | 13,768,219 | 73,160,083 | 7% | 4.8% |
| Nov. | 12,673,507 | 66,654,429 | 3.3% | 0.8% |
| Dec. | 14,142,650 | 66,746,052 | 5.4% | -14.8% |
| Jan.-Dec. | 169,224,846 | 813,625,037 | -1.5% | -10.8% |
From January to December in 2014, Chinese nonelectrical lamps and lighting fittings export volume accounts for 169200 tons, decreasing by 1.5% compared to the same period last year; the export value accounts for 814 million dollars, decreasing by 10.8% compared to the same period last year.
Jan. to Dec. 2014 Distribution of Chinese Nonelectrical Lamps and Lighting Fittings' Export Countries or Regions
| NO. | Countries | Volume(kg) | Value(USD) | Compared to the same period last year | |
| Volume | Value | ||||
| 1 | USA | 47,488,185 | 226,491,681 | -7.2% | -20.6% |
| 2 | Germany | 22,497,308 | 92,807,573 | 4.7% | -4.4% |
| 3 | Netherlands | 17,018,049 | 66,858,377 | 10.9% | -8.6% |
| 4 | Iran | 3,636,407 | 45,004,172 | 92.2% | 104% |
| 5 | United Kingdom | 8,883,482 | 41,669,925 | 9.5% | -8.7% |
| 6 | United Arab Emirates | 2,548,312 | 21,934,575 | 18.5% | 47.1% |
| 7 | Canada | 3,650,326 | 20,260,663 | -35.6% | -41.7% |
| 8 | Australia | 3,896,462 | 16,429,464 | -9% | -22% |
| 9 | Sweden | 4,799,195 | 16,309,471 | 6.4% | -2.1% |
| 10 | Denmark | 3,624,894 | 14,955,457 | 31% | 30.7% |
| 11 | Russian Federation | 1,221,190 | 13,261,604 | 24% | 150.3% |
| 12 | France | 3,299,766 | 13,206,763 | 6.2% | -12.8% |
| 13 | Belgium | 3,227,342 | 12,949,910 | 5.9% | -9.5% |
| 14 | Italy | 3,054,083 | 12,757,615 | 35.2% | 14.7% |
| 15 | Poland | 3,179,664 | 10,577,459 | 41.5% | 8.9% |
| 16 | Saudi Arabia | 1,515,327 | 9,936,520 | 6.2% | -11.7% |
| 17 | Malaysia | 1,406,976 | 9,863,239 | -16.2% | -38.8% |
| 18 | Singapore | 861,306 | 8,751,400 | -22.8% | -42.9% |
| 19 | Panama | 1,024,836 | 8,076,414 | 72.8% | 51.2% |
| 20 | Brazil | 1,470,358 | 7,606,725 | -22.6% | -35.4% |
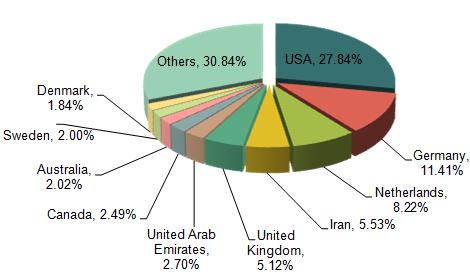
According to the exports data from January to December in 2014, Chinese nonelectrical lamps and lighting fittings major export markets are USA, Germany, Netherlands, Iran, United Kingdom, United Arab Emirates, Canada, Australia, Sweden and Denmark etc.
USA, Germany and Netherlands are the first three biggest export markets of Chinese nonelectrical lamps and lighting fittings, accounting for 27.84%,11.41% and 8.22% of the total.
From January to December in 2014, among the first 20 Chinese nonelectrical lamps and lighting fittings export markets, the Russian Federation export value increased at the fastest speed, increasing by 150.3% compared to the same period of 2013.
Jan. to Dec. 2014 Major Export Original Places of Chinese Nonelectrical Lamps and Lighting Fittings
| NO. | region | Volume(kg) | Value(USD) | Compared to the same period last year | |
| Volume | Value | ||||
| 1 | Guangdong | 26,882,983 | 275,129,322 | -14.3% | -15.7% |
| 2 | Zhejiang | 64,214,391 | 242,069,785 | -4.1% | 1.2% |
| 3 | Fujian | 22,713,362 | 104,193,610 | -1.1% | 6.5% |
| 4 | Jiangsu | 14,864,375 | 46,414,161 | 10.2% | -12.4% |
| 5 | Shandong | 19,471,982 | 37,647,252 | 26.1% | 10.8% |
| 6 | Anhui | 4,485,358 | 33,455,445 | 4.8% | -27.5% |
| 7 | Shanghai | 4,492,621 | 18,769,261 | -4.1% | -8.1% |
| 8 | Shanxi | 3,547,056 | 12,505,838 | 36.3% | 22.7% |
| 9 | Hebei | 3,181,305 | 8,587,960 | -8.3% | -17.2% |
| 10 | Henan | 598,295 | 4,623,485 | 1086.6% | 764.5% |
Guangdong, Zhejiang and Fujian are the major original places. From January to December in 2014, the three provinces' nonelectrical lamps and lighting fittings export volume accounts for 67.25% of the total export volume, its export value accounts for 76.37% of the total.
From January to December in 2014, among the first 10 nonelectrical lamps and lighting fittings' original places, the nonelectrical lamps and lighting fittings of Henan export volume increased by 764.5% at the fastest speed compared to the same period last year.
Data Source: the customs information network


