Germany Plastic Sanitary Ware (HS: 3922) Import Trend Analysis from 2010 to 2013
Germany Plastic Sanitary Ware Import Value Trend from 2010 to 2012
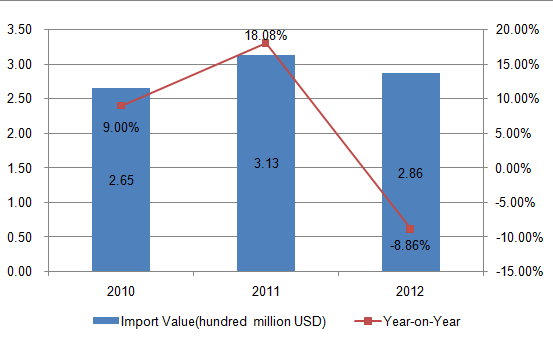
The total import value of Germany plastic sanitary ware from 2010 to 2012 showed an inverted "V" trend. And the total import value of the three years amounted to 341 million US dollars, 403 million US dollars and 363 million US dollars respectively, among of which, the import value of 2012 decreased by 10.01% year on year.
Germany Plastic Sanitary Ware Major Import Countries/Regions from 2010 to 2012
| No. | Import Countries/Regions | Import Value (Thousand USD) | Import Value Growth Compared 2012 to 2010 | ||
|
|
| 2010 | 2011 | 2012 |
|
| 1 | China | 60,803 | 60,537 | 56,307 | -7.39% |
| 2 | Switzerland | 33,971 | 40,894 | 38,711 | 13.95% |
| 3 | Netherlands | 30,565 | 37,543 | 31,975 | 4.61% |
| 4 | Austria | 14,612 | 25,168 | 31,517 | 115.69% |
| 5 | Italy | 33,135 | 36,088 | 30,582 | -7.70% |
| 6 | Egypt | 23,438 | 31,739 | 28,559 | 21.85% |
| 7 | Denmark | 26,257 | 30,457 | 22,507 | -14.28% |
| 8 | Bulgaria | 18,633 | 21,377 | 18,455 | -0.96% |
| 9 | Poland | 13,655 | 15,003 | 14,839 | 8.67% |
| 10 | France | 15,009 | 20,055 | 12,844 | -14.42% |
| 11 | United Kingdom | 15,062 | 15,525 | 10,343 | -31.33% |
| 12 | Belgium | 8,503 | 10,002 | 9,676 | 13.80% |
| 13 | Slovenia | 7,957 | 9,622 | 8,595 | 8.02% |
| 14 | Czech | 8,336 | 8,089 | 7,178 | -13.89% |
| 15 | Turkey | 6,799 | 7,153 | 5,629 | -17.21% |
| 16 | Portugal | 1,569 | 6,189 | 5,328 | 239.58% |
| 17 | United Arab Emirates | 5,110 | 6,445 | 5,269 | 3.11% |
| 18 | Croatia | 2,573 | 2,735 | 2,914 | 13.25% |
| 19 | Hungary | 701 | 3,502 | 2,845 | 305.85% |
| 20 | Slovakia | 2,240 | 2,392 | 2,800 | 25.00% |
China, Switzerland and the Netherlands are Germany's three largest plastic sanitary ware import countries from 2010 to 2012. Among Germany top twenty plastic sanitary ware import markets in 2012, Hungary's import value of plastic sanitary ware increased by 305.85% compared to that of 2010, which was the largest increase, followed by Portugal, the import value of which increased by 239.58% compared to that of 2010.
Germany Plastic Sanitary Ware Major Import Countries/Regions Market Share from 2010 to 2012
| No. | Import Countries/Regions | Import Value Percentage | ||
|
|
| 2010 | 2011 | 2012 |
| 1 | China | 17.83% | 15.02% | 15.52% |
| 2 | Switzerland↑ | 9.96% | 10.15% | 10.67% |
| 3 | Netherlands | 8.96% | 9.32% | 8.82% |
| 4 | Austria↑ | 4.28% | 6.24% | 8.69% |
| 5 | Italy↓ | 9.71% | 8.95% | 8.43% |
| 6 | Egypt | 6.87% | 7.87% | 7.87% |
| 7 | Denmark↓ | 7.70% | 7.56% | 6.21% |
| 8 | Bulgaria↓ | 5.46% | 5.30% | 5.09% |
| 9 | Poland | 4.00% | 3.72% | 4.09% |
| 10 | France | 4.40% | 4.98% | 3.54% |
| 11 | United Kingdom↓ | 4.42% | 3.85% | 2.85% |
| 12 | Belgium | 2.49% | 2.48% | 2.67% |
| 13 | Slovenia | 2.33% | 2.39% | 2.37% |
| 14 | Czech↓ | 2.44% | 2.01% | 1.98% |
| 15 | Turkey↓ | 1.99% | 1.77% | 1.55% |
| 16 | Portugal | 0.46% | 1.54% | 1.47% |
| 17 | United Arab Emirates | 1.50% | 1.60% | 1.45% |
| 18 | Croatia | 0.75% | 0.68% | 0.80% |
| 19 | Hungary | 0.21% | 0.87% | 0.78% |
| 20 | Slovakia | 0.66% | 0.59% | 0.77% |
Note: "↑"represents that the indicators listed continued to increase from 2010 to 2012, "↓"represents that the indicators listed continued to decrease from 2010 to 2012.
Judging from the market share, the import value in proportion of Switzerland and Austria continued to rise, while that of Italy, Denmark, Bulgaria, the United Kingdom, the Czech Republic and Turkey continued to decline from 2010 to 2012.
Germany Plastic Sanitary Ware Major Import Countries/Regions from Jan. to Aug. 2013
| Countries/Regions | Import Value of Jan.-August 2013 (thousand US dollars) | YOY | Percentage |
| Total | 247,547 | 7.18% | 100.00% |
| China | 39,333 | 13.94% | 15.89% |
| Austria | 24,524 | 41.40% | 9.91% |
| Netherlands | 24,298 | 1.67% | 9.82% |
| Switzerland | 22,040 | -13.74% | 8.90% |
| Italy | 18,244 | 3.50% | 7.37% |
| Bulgaria | 16,849 | 27.14% | 6.81% |
| Denmark | 14,971 | -2.02% | 6.05% |
| Egypt | 13,878 | 20.62% | 5.61% |
| Poland | 11,965 | 20.59% | 4.83% |
| Belgium | 11,302 | 9.98% | 4.57% |
From Jan. to Aug. 2013, Germany's import value of plastic sanitary ware amounted to 248 million US dollars, with an increase of 7.18%, and the import value of China plastic sanitary ware amounted to 39.333 million US dollars, accounting for 15.89% of the total import value, followed by Austria, accounting for 9.91% of the total import value.


