Note:
HS Code 940151:Seats (Of bamboo or rattan)
HS Code 940161:Seats with wooden frames, upholstered
HS Code 940171:Seats with metal frames, upholstered
China Bamboo or Rattan Seats (HS: 940151) Export Situation from Jan. to May in 2013
China Bamboo or Rattan Seats (HS: 940151) Export Volume and on Year-on-Year Basis from Jan. to May in 2013
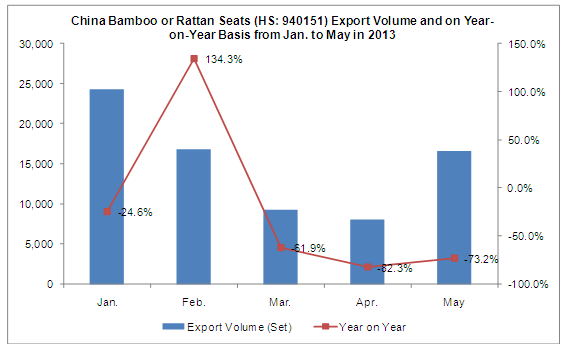
From Jan. to May in 2013 total export volume of China Bamboo or Rattan Seats amounted to 75,260 sets, with a decrease of 56.2% year on year.
China Bamboo or Rattan Seats (HS: 940151) Export Value and on Year-on-Year Basis from Jan. to May in 2013
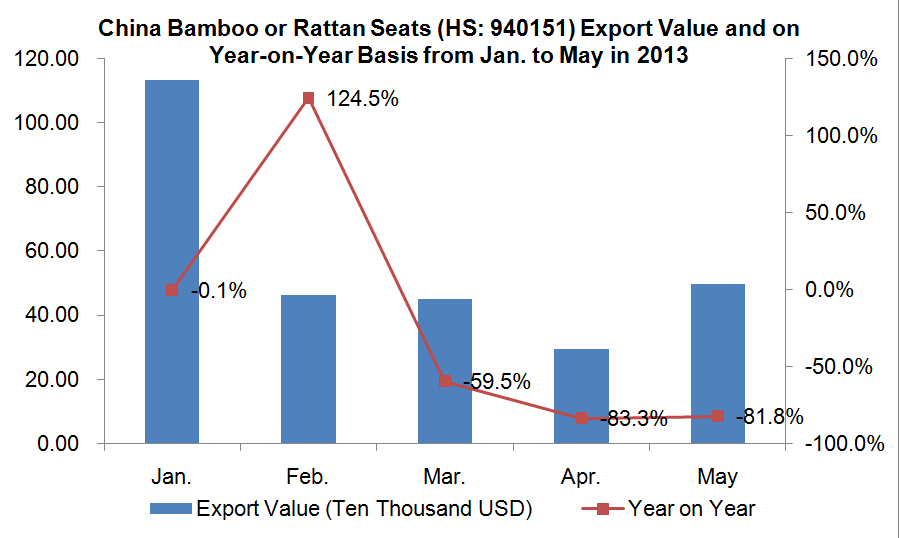
From Jan. to May in 2013 total export value of China Bamboo or Rattan Seats amounted to 2,846,000 USD, with a decrease of 59.3% year on year.
China Bamboo or Rattan Seats (HS: 940151) The Top Ten Export Destination Countries/Regions from Jan. to May in 2013
| NO. | Country | Volume (Set) | Value (USD) | Year on Year | |
| Volume | Value | ||||
| 1 | USA | 28,477 | 637,228 | 4% | -5.60% |
| 2 | Thailand | 4,177 | 310,000 | -55% | -16.40% |
| 3 | Malaysia | 4,616 | 237,868 | 548.30% | 675.40% |
| 4 | Indonesia | 2,972 | 213,200 | / | / |
| 5 | Australia | 7,872 | 210,740 | -9.10% | 51.70% |
| 6 | Japan | 5,528 | 206,251 | 21.10% | 16.50% |
| 7 | Myanmar | 1,618 | 100,316 | -70.90% | -77.10% |
| 8 | Vietnam | 1,554 | 96,348 | 300.50% | 231.10% |
| 9 | Singapore | 2,374 | 93,672 | -92% | -91.50% |
| 10 | Russian Federation | 776 | 86,746 | -89.40% | -60.60% |
From Jan. to May in 2013, among the top ten China Bamboo or Rattan Seats export destination countries/regions, from the export value year on year, there was the largest increase in Malaysia (with an increase of 675.4% year on year), followed by Vietnam (with an increase of 231.1% year on year).
China Bamboo or Rattan Seats (HS: 940151) The Top Ten Export Source Areas from Jan. to May in 2013
| NO. | Country | Volume (Set) | Value (USD) | Year on Year | |
| Volume | Value | ||||
| 1 | Guangdong | 30,432 | 902,052 | -36.8% | -55.6% |
| 2 | Shanxi | 12,459 | 865,068 | 118.3% | 128.2% |
| 3 | Zhejiang | 13,962 | 324,550 | -69.5% | -84.5% |
| 4 | Anhui | 776 | 273,297 | -95.8% | -63.5% |
| 5 | Shanghai | 6,924 | 183,632 | -54.8% | -40.1% |
| 6 | Fujian | 6,520 | 125,222 | -56.5% | -66.3% |
| 7 | Beijing | 1,890 | 100,956 | -56.6% | -29.1% |
| 8 | Jiangxi | 478 | 35,089 | -95.4% | -90.5% |
| 9 | Jiangsu | 1,258 | 15,050 | 31350.0% | 9306.3% |
| 10 | Tianjin | 116 | 12,605 | / | / |
Guangdong, Shaanxi and Zhejiang are our Bamboo or Rattan Seats main export source areas. The Bamboo or Rattan Seats export volume of the above three provinces accounted for 75.54% of total export volume from Jan. to May in 2013, and the export value together accounted for 73.49% of total export value. Among Our top ten Bamboo or Rattan Seats export source areas, there was the largest increase of both export volume and value in Jiangsu Province, with an increase of 31350% year on year of export volume and 9306.3% year on year of export value.
China Seats with Wooden Frames, Upholstered (HS: 940161) Export Situation from Jan. to May in 2013
China Seats with Wooden Frames, Upholstered (HS: 940161) Export Volume and on Year-on-Year Basis from Jan. to May in 2013
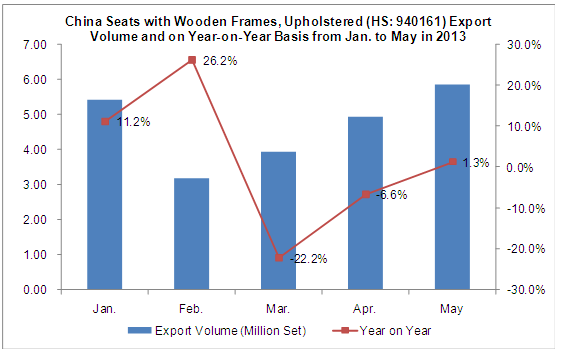
From Jan. to May in 2013 total export volume of China Seats with Wooden Frames, Upholstered amounted to 23378000 sets, with a decrease of 0.9% year on year.
China Seats with Wooden Frames, Upholstered (HS: 940161) Export Value and on Year-on-Year Basis from Jan. to May in 2013
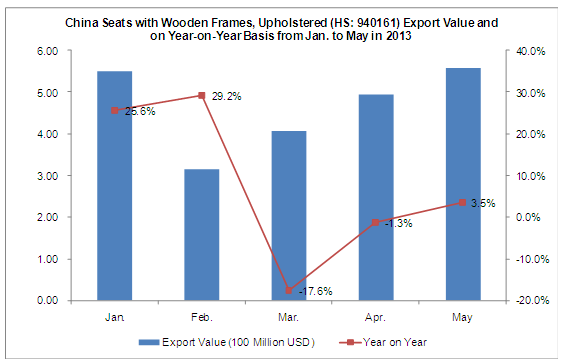
From Jan. to May in 2013 total export value of China Seats with Wooden Frames, Upholstered amounted to 2.324 billion USD, with an increase of 4.9% year on year.
China Seats with Wooden Frames, Upholstered (HS: 940161) The Top Ten Export Destination Countries/Regions from Jan. to May in 2013
| NO. | Country | Volume (Set) | Value (USD) | Year on Year | |
| Volume | Value | ||||
| 1 | USA | 9,853,162 | 935,463,828 | 1.8% | 6.2% |
| 2 | UK | 1,771,142 | 197,119,970 | 12.5% | -3.3% |
| 3 | Japan | 1,383,406 | 134,395,591 | -4.6% | 6.5% |
| 4 | Australia | 1,037,781 | 130,413,709 | 17.6% | 10.8% |
| 5 | Canada | 1,259,952 | 127,262,877 | -11.7% | -7.2% |
| 6 | South Korea | 574,118 | 78,712,237 | -2.4% | 15.8% |
| 7 | France | 755,546 | 63,861,707 | -28.4% | -23.7% |
| 8 | Saudi Arabia | 405,515 | 57,393,783 | 6.8% | 13.5% |
| 9 | UAE | 304,447 | 53,010,310 | 7.6% | 32.0% |
| 10 | Germany | 910,313 | 47,499,783 | 6.1% | -10.1% |
From Jan. to May in 2013, among the top ten China Seats with Wooden Frames, Upholstered export destination countries/regions, from the export value year on year, there was the largest increase in UAE (with an increase of 32% year on year), followed by South Korea (with an increase of 15.8% year on year).
China Seats with Wooden Frames, Upholstered (HS: 940161) The Top Ten Export Source Areas from Jan. to May in 2013
| NO. | Country | Volume (Set) | Value (USD) | Year on Year | |
| Volume | Value | ||||
| 1 | Guangdong | 9,203,307 | 1,068,328,197 | -4.9% | 7.5% |
| 2 | Zhejiang | 7,832,118 | 613,963,703 | 3.4% | 7.3% |
| 3 | Jiangsu | 1,208,795 | 250,740,173 | -2.3% | -3.4% |
| 4 | Shanghai | 1,273,751 | 186,009,035 | -14.2% | -8.4% |
| 5 | Shandong | 2,024,720 | 89,609,840 | 15.8% | 16.3% |
| 6 | Fujian | 824,165 | 38,092,357 | -5.1% | -9.6% |
| 7 | Tianjin | 175,902 | 18,301,991 | 76.5% | 33.3% |
| 8 | Liaoning | 268,078 | 12,061,162 | 8.5% | -1.5% |
| 9 | Beijing | 51,888 | 11,987,609 | -31% | 24.3% |
| 10 | Xinjiang Uygur Autonomous Region | 169,875 | 9,955,866 | -10.2% | -8.6% |
Guangdong, Zhejiang, Jiangsu, Shanghai and Shandong are our Seats with Wooden Frames, Upholstered main export source areas. The Seats with Wooden Frames, Upholstered export volume of the above five provinces accounted for 92.15% of total export volume from Jan. to May in 2013, and the export value together accounted for 95.03% of total export value. Among Our top ten Seats with Wooden Frames, Upholstered export source areas, there was the largest increase of both export volume and value in Tianjin Province, with an increase of 76.5% year on year of export volume and 33.3% year on year of export value.
China Seats with Metal Frames, Upholstered (HS: 940171) Export Volume and on Year-on-Year Basis from Jan. to May in 2013
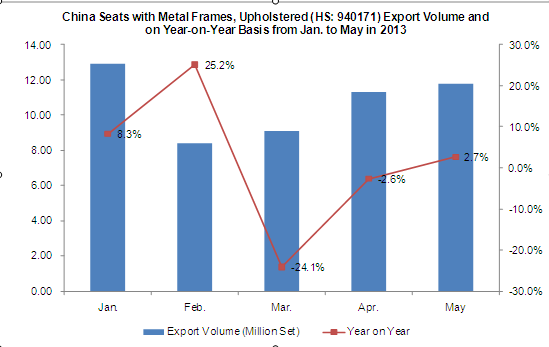
From Jan. to May in 2013 total export volume of China Seats with Metal Frames, Upholstered amounted to 53513000 sets, with a decrease of 0.4% year on year.
China Seats with Metal Frames, Upholstered (HS: 940171) Export Value and on Year-on-Year Basis from Jan. to May in 2013
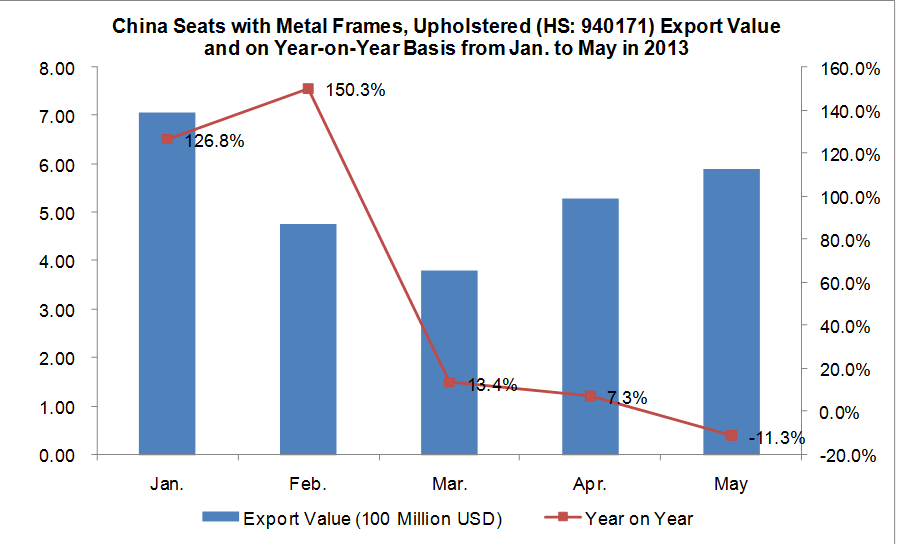
From Jan. to May in 2013 total export value of China Seats with Metal Frames, Upholstered amounted to 2.685 billion USD, with an increase of 34.5% year on year.
China Seats with Metal Frames, Upholstered (HS: 940171) The Top Ten Export Destination Countries/Regions from Jan. to May in 2013
| NO. | Country | Volume (Set) | Value (USD) | Year on Year | |
| Volume | Value | ||||
| 1 | USA | 14,962,830 | 545,454,538 | 5.8% | 5.1% |
| 2 | Germany | 3,294,052 | 148,658,207 | -14.2% | -16.1% |
| 3 | Netherlands | 1,692,555 | 116,804,919 | -12.5% | 13.1% |
| 4 | UK | 2,114,916 | 105,608,746 | 4.7% | 9.6% |
| 5 | Singapore | 466,214 | 104,777,840 | -19.8% | 113.5% |
| 6 | Malaysia | 763,744 | 103,352,078 | -17.7% | 66.5% |
| 7 | Canada | 2,094,183 | 95,123,185 | 2.6% | 12.3% |
| 8 | South Africa | 505,897 | 76,686,198 | 38.8% | 265.4% |
| 9 | Australia | 1,050,593 | 75,493,453 | 20.4% | 35.2% |
| 10 | UAE | 755,643 | 70,020,677 | 13.1% | 64.6% |
From Jan. to May in 2013, among the top ten China Seats with Metal Frames, Upholstered export destination countries/regions, from the export value year on year, there was the largest increase in South Africa (with an increase of 265.4% year on year), followed by Singapore (with an increase of 113.5% year on year).
China Seats with Metal Frames, Upholstered (HS: 940171) The Top Ten Export Source Areas from Jan. to May in 2013
| NO. | Country | Volume (Set) | Value (USD) | Year on Year | |
| Volume | Value | ||||
| 1 | Guangdong | 16,413,229 | 1,481,202,254 | -7.2% | 67.6% |
| 2 | Zhejiang | 13,057,067 | 443,489,088 | 5.0% | 2.9% |
| 3 | Fujian | 12,111,330 | 132,290,458 | -10.2% | -11.1% |
| 4 | Jiangxi | 1,143,702 | 96,465,179 | 18.9% | 14.2% |
| 5 | Jiangsu | 2,046,065 | 88,195,955 | 31.1% | 46.6% |
| 6 | Hebei | 4,725,485 | 72,452,287 | 17.5% | 34.0% |
| 7 | Chongqing | 220,196 | 65,931,945 | -38.3% | -57.9% |
| 8 | Anhui | 293,801 | 57,292,187 | 176.6% | 1681.9% |
| 9 | Liaoning | 373,909 | 57,164,889 | -11.6% | 241.1% |
| 10 | Shanghai | 877,028 | 57,019,547 | 85.7% | 63.0% |
Guangdong, Zhejiang and Fujian are our Seats with Metal Frames, Upholstered main export source areas. The Seats with Wooden Frames, Upholstered export volume of the above three provinces accounted for 77.7% of total export volume from Jan. to May in 2013, and the export value together accounted for 76.61% of total export value. Among Our top ten Seats with Metal Frames, Upholstered export source areas, there was the largest increase of both export volume and value in Anhui Province, with an increase of 176.6% year on year of export volume and 1681.9% year on year of export value.


