The United States Plastic Sanitary Ware (HS: 3922) Import Trend Analysis from 2010 to 2013
The United States Plastic Sanitary Ware Import Value Trend from 2010 to 2012
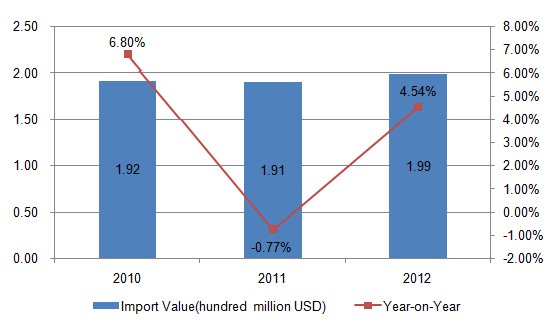
The total import value of the United States plastic sanitary ware from 2010 to 2012 showed a "V" trend. And the total import value of the three years amounted to 192 million US dollars, 191 million US dollars and 199 million US dollars respectively, among of which, the import value of 2012 increased by 4.54% year on year.
The United States Plastic Sanitary Ware Major Import Countries/Regions from 2010 to 2012
| No. | Import Countries/Regions | Import Value (Thousand USD) | Import Value Growth Compared 2012 to 2010 | ||
|
|
| 2010 | 2011 | 2012 |
|
| 1 | China | 69,437 | 71,917 | 84,113 | 21.14% |
| 2 | Canada | 49,962 | 53,363 | 55,450 | 10.98% |
| 3 | Mexico | 33,674 | 28,636 | 25,810 | -23.35% |
| 4 | Japan | 11,575 | 8,836 | 5,053 | -56.35% |
| 5 | Germany | 3,233 | 3,473 | 4,426 | 36.90% |
| 6 | South Korea | 5,055 | 4,662 | 3,374 | -33.25% |
| 7 | Malaysia | 13 | 326 | 3,269 | 25046.15% |
| 8 | India | 3,460 | 3,665 | 2,905 | -16.04% |
| 9 | Taiwan | 2,585 | 2,055 | 2,822 | 9.17% |
| 10 | Italy | 1,534 | 1,102 | 1,697 | 10.63% |
| 11 | United Kingdom | 1,506 | 1,340 | 1,402 | -6.91% |
| 12 | Sweden | 1,218 | 1,382 | 1,327 | 8.95% |
| 13 | Vietnam | 574 | 1,638 | 1,306 | 127.53% |
| 14 | South Africa | 2,007 | 2,732 | 1,287 | -35.87% |
| 15 | Netherlands | 2,147 | 2,239 | 1,113 | -48.16% |
| 16 | Egypt | 948 | 649 | 939 | -0.95% |
| 17 | Hong Kong | 273 | 187 | 769 | 181.68% |
| 18 | Poland | 379 | 197 | 331 | -12.66% |
| 19 | Spain | 274 | 469 | 247 | -9.85% |
| 20 | Denmark | 150 | 141 | 241 | 60.67% |
China, Canada and Mexico are the United States' three largest plastic sanitary ware import countries from 2010 to 2012. Among the United States top twenty plastic sanitary ware import markets in 2012, Malaysia's import value of plastic sanitary ware increased by 25046.15% compared to that of 2010, which was the largest increase, followed by Hong Kong, the import value of which increased by 181.68% compared to that of 2010, Vietnam ranked the third, the import value of which increased by 127.53% compared to that of 2010.
The United States Plastic Sanitary Ware Major Import Countries/Regions Market Share from 2010 to 2012
| No. | Import Countries/Regions | Import Value Percentage | ||
|
|
| 2010 | 2011 | 2012 |
| 1 | China↑ | 36.13% | 37.71% | 42.19% |
| 2 | Canada | 26.00% | 27.98% | 27.81% |
| 3 | Mexico↓ | 17.52% | 15.02% | 12.95% |
| 4 | Japan↓ | 6.02% | 4.63% | 2.53% |
| 5 | Germany↑ | 1.68% | 1.82% | 2.22% |
| 6 | South Korea↓ | 2.63% | 2.44% | 1.69% |
| 7 | Malaysia↑ | 0.01% | 0.17% | 1.64% |
| 8 | India | 1.80% | 1.92% | 1.46% |
| 9 | Taiwan | 1.35% | 1.08% | 1.42% |
| 10 | Italy | 0.80% | 0.58% | 0.85% |
| 11 | UNITED KINGDOM | 0.78% | 0.70% | 0.70% |
| 12 | Sweden | 0.63% | 0.72% | 0.67% |
| 13 | Vietnam | 0.30% | 0.86% | 0.66% |
| 14 | South Africa | 1.04% | 1.43% | 0.65% |
| 15 | Netherlands | 1.12% | 1.17% | 0.56% |
| 16 | Egypt | 0.49% | 0.34% | 0.47% |
| 17 | Hong Kong | 0.14% | 0.10% | 0.39% |
| 18 | Poland | 0.20% | 0.10% | 0.17% |
| 19 | Spain | 0.14% | 0.25% | 0.12% |
| 20 | Denmark | 0.08% | 0.07% | 0.12% |
Note: “↑”represents that the indicators listed continued to increase from 2010 to 2012, “↓”represents that the indicators listed continued to decrease from 2010 to 2012.
Judging from the market share, the import value in proportion of China, Germany and Malaysia continued to rise, while that of Mexico, Japan and South Korea continued to decline from 2010 to 2012.
The United States Plastic Sanitary Ware Major Import Countries/Regions from Jan. to Aug. 2013
| Countries/Regions | Import Value of Jan.-August 2013 (thousand US dollars) | YOY | Percentage |
| Total | 150,377 | 12.59% | 100.00% |
| China | 60,106 | 7.93% | 39.97% |
| Canada | 40,767 | 7.66% | 27.11% |
| Mexico | 22,737 | 28.85% | 15.12% |
| Malaysia | 5,358 | 938.37% | 3.56% |
| Germany | 3,632 | 14.11% | 2.42% |
| India | 2,179 | 18.10% | 1.45% |
| South Africa | 2,073 | 112.40% | 1.38% |
| Taiwan | 1,950 | 8.94% | 1.30% |
| South Korea | 1,919 | -21.35% | 1.28% |
| Japan | 1,156 | -72.97% | 0.77% |
From Jan. to Aug. 2013, the United States' import value of plastic sanitary ware amounted to 150 million US dollars, and the import value of China plastic sanitary ware amounted to 60.106 million US dollars, accounting for 39.97% of the total import value, followed by Canada, accounting for 27.11%, and Mexico ranked the third, accounting for 15.12% of the total import value.


