Annual Export Trends of China's Agriculture, Horticulture or Forestry Hand Tools
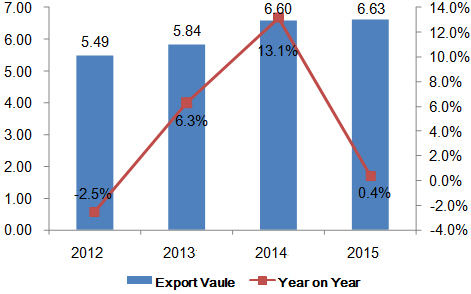
China's agriculture, horticulture or forestry hand tools export trended down during the period from 2012 to 2015. The export value in 2015 was USD 663,000,000, growing 20.7% on year.
Monthly Export Trends of China's Agriculture, Horticulture or Forestry Hand Tools
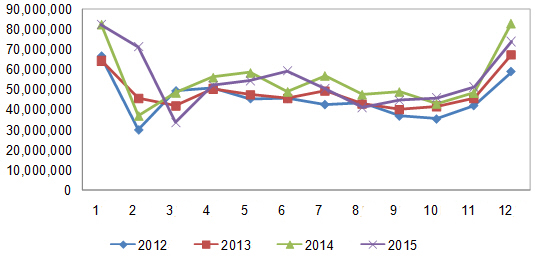
According to the chart above, from 2012 to 2015, China's agriculture, horticulture or forestry hand tools export surged in winter. In 2015, exports peak was in January and trough was in March.
China's Agriculture, Horticulture or Forestry Hand Tools Export Volume & Value in 2015
| Month | Volume(kg) | Value(USD) | on Year | |
| Volume | Value | |||
| January | 29,814,215 | 82,460,040 | -8.40% | -0.60% |
| February | 25,718,481 | 71,439,944 | 88.80% | 93% |
| March | 11,680,154 | 33,946,093 | -37.80% | -30.20% |
| April | 20,832,007 | 52,329,925 | -10.50% | -6.80% |
| May | 21,126,843 | 54,513,250 | -17% | -6.80% |
| June | 22,235,543 | 59,511,942 | 5.10% | 21.30% |
| July | 19,767,195 | 50,606,232 | -14.60% | -11.30% |
| August | 14,882,421 | 41,494,594 | -26.20% | -13% |
| September | 16,982,410 | 44,869,784 | -14% | -8.50% |
| October | 17,320,220 | 46,161,437 | -3% | 7.10% |
| November | 18,964,107 | 51,511,521 | -2.20% | 6.40% |
| December | 25,537,279 | 73,991,642 | -10.10% | -10.80% |
| Total | 244,860,875 | 662,836,404 | -7.10% | 0.30% |
China's agriculture, horticulture or forestry hand tools export value reached USD 663,000,000 in 2015, growing 0.3% on year.
Top Destinations for China's Agriculture, Horticulture or Forestry Hand Tools
| No. | Country | Volume(kg) | Value(USD) | on Year | |
| Volume | Value | ||||
| 1 | United States | 36,060,168 | 127,273,772 | 3% | 5.40% |
| 2 | United Kingdom | 8,036,202 | 33,118,925 | 9% | 15.30% |
| 3 | Japan | 8,035,755 | 29,290,324 | -10.90% | -9.60% |
| 4 | Kenya | 15,993,671 | 23,727,964 | -4% | -0.60% |
| 5 | Germany | 6,236,308 | 22,855,423 | -13.20% | -10.30% |
| 6 | Netherland | 6,550,176 | 22,375,689 | -19% | -13.50% |
| 7 | Vietnam | 3,115,385 | 18,648,756 | 71.50% | 72.90% |
| 8 | Australia | 5,535,184 | 16,184,649 | -7.90% | -14.80% |
| 9 | Tanzania | 9,700,469 | 15,511,523 | -28.20% | -20.90% |
| 10 | Russian Federation | 6,499,698 | 15,384,623 | -35.90% | -32.60% |
| 11 | Canada | 4,140,653 | 14,602,070 | -11.70% | -15.30% |
| 12 | Korea | 5,654,720 | 13,589,166 | -5.10% | 4.70% |
| 13 | Mexico | 4,125,737 | 10,755,407 | 22.60% | 19.80% |
| 14 | France | 2,974,399 | 9,684,463 | -18.40% | -11.70% |
| 15 | Malaysia | 4,730,217 | 9,519,670 | -25.40% | -22% |
| 16 | Ghana | 4,886,631 | 9,362,497 | 58% | 99.40% |
| 17 | United Arab Emirates | 4,878,280 | 8,873,945 | -4.40% | -8.50% |
| 18 | Nigeria | 6,088,256 | 8,764,827 | -18.50% | -29.80% |
| 19 | Poland | 2,711,827 | 7,669,032 | -15.30% | -9.90% |
| 20 | Algeria | 2,833,075 | 7,436,627 | 0.20% | 33.10% |
From January to December in 2015, the top export destinations of China's agriculture, horticulture or forestry hand tools were the United States, Japan and the United Kingdom. In 2015, China exports to Ghana grew faster than exports to other markets and the growth was 99.4% on year.
Export Origins of China's Agriculture, Horticulture or Forestry Hand Tools
| No. | District | Volume(kg) | Value(USD) | on Year | |
| Volume | Value | ||||
| 1 | Zhejiang | 48,986,387 | 191,917,554 | -3% | 23% |
| 2 | Hebei | 112,395,381 | 171,473,292 | -3.40% | -6% |
| 3 | Guangdong | 29,573,896 | 149,660,124 | -6.60% | -1.30% |
| 4 | Jiangsu | 9,577,730 | 33,878,553 | -13.30% | -6.30% |
| 5 | Shandong | 15,475,193 | 32,525,726 | -16.60% | -9.20% |
| 6 | Shanghai | 6,618,343 | 22,102,550 | 8.50% | 0.10% |
| 7 | Tianjin | 8,470,663 | 18,110,414 | -25.80% | -21% |
| 8 | Jiangxi | 2,242,228 | 7,676,929 | -23.60% | -8.40% |
| 9 | Liaoning | 2,650,315 | 6,897,360 | -35.20% | -40.70% |
| 10 | Fujian | 1,412,302 | 5,113,423 | -21.30% | -28.70% |
| 11 | Hunan | 3,066,284 | 5,111,648 | 4.80% | 15.90% |
| 12 | Xinjiang | 1,275,420 | 4,823,269 | -41.80% | -41.50% |
| 13 | Guangxi | 627,509 | 2,760,599 | -6.10% | -25.90% |
| 14 | Chongqing | 328,398 | 2,245,143 | 25.50% | 141.70% |
| 15 | Sichuan | 331,125 | 1,704,404 | -13.20% | 25.70% |
| 16 | Anhui | 197,025 | 1,662,147 | -31.70% | 13.90% |
| 17 | Yunnan | 211,576 | 1,210,293 | 238.30% | 343.20% |
| 18 | Shaanxi | 728,548 | 956,295 | -3.60% | -37.50% |
| 19 | Heilongjiang | 65,532 | 653,965 | -33.50% | 64.20% |
| 20 | Beijing | 220,057 | 653,925 | -7% | 16.90% |
The top origins of China's agriculture, horticulture or forestry hand tools were Guangdong province, Zhejiang province and Hebei province in 2015. Zhejiang province exported USD 191,917,554, making the largest export origins in China.

")


