Note:
| HS Code | Product Name |
| 3001 | Glands and other organs for organ therapeutic uses, dried, whether or not powdered; extracts of glands or other organs or of their secretions for organ therapeutic uses; heparin and its salts; other human or animal substances prepared for therapeutic or disease prevention; hereinafter referred to as "dried glands and other organs for organ therapeutic uses, extracts of glands or other organs, heparin and its salts, human or animal substances". |
| 3002 | Human blood; animal blood prepared for therapeutic, prophylactic or diagnostic uses; antisera, other blood fractions and immunological products, whether or not modified or obtained by means of biotechnological processes; vaccines, toxins, cultures of microorganisms (excluding yeasts) and similar products; hereinafter referred to as "human blood; animal blood; antisera, other blood fractions and immunological products; vaccines, toxins, cultures of microorganisms and similar products". |
| 3003 | Medicaments (excluding goods of heading No. 30. 02, 30. 05 or 30. 06) consisting of two or more constituents which have been mixed together for therapeutic or prophylactic uses, not put up in measured doses or in forms of packing for retail sale; hereinafter referred to as "Medicaments consisting of two or more constituents which have been mixed together for therapeutic or prophylactic uses, not put up in measured doses or in forms of packing for retail sale". |
| 3004 | Medicaments (excluding goods of heading 30.02, 30.05 or 30.06) consisting of mixed or unmixed products for therapeutic or prophylactic uses, put up in measured doses (including those in the form of transdermal administration systems) or in forms of packing for retail sale; hereinafter referred to as "medicaments consisting of mixed or unmixed products for therapeutic or prophylactic uses, put up in measured doses or in forms of packing for retail sale". |
| 3005 | Wadding, gauze, bandages and similar articles (for example, dressings, adhesive plasters, poultices), impregnated or coated with pharmaceutical substances or put up in forms or packing for retail sale for medical, surgical, dental or veterinary purposes; hereinafter referred to as "wadding, gauze, bandages and similar articles". |
| 3006 | Pharmaceutical goods specified in Note 4 to this Chapter, hereinafter referred to as "Hemostatic material, blood reagents, X-ray contrast agent, bone cements, first aid kit, birth control pills, gels and other products, and waste pharmaceuticals, etc". |
Chinese Exports of Dried Glands and Other Organs for Organ Therapeutic Uses, Extracts of Glands or Other Organs, Heparin and Its Salts, Human or Animal Substances (HS: 3001) in 2013
Major Exporting Countries / Regions Distribution of Dried Glands and Other Organs for Organ Therapeutic Uses, Extracts of Glands or Other Organs, Heparin and Its Salts, Human or Animal Substances (HS: 3001) from Jan. to May. in 2013
| No. | Countries / Regions | Quantity (kg) | Amount (USD) | Year on Year | |
| Volume | Value | ||||
| 1 | France | 11,786 | 79,665,225 | -39.7% | 0.6% |
| 2 | USA | 867,911 | 60,220,244 | -18.3% | -45.1% |
| 3 | Germany | 39,385 | 56,812,780 | -16.0% | -7.5% |
| 4 | Italy | 13,487 | 33,024,680 | -52.8% | 133.8% |
| 5 | Japan | 330,637 | 30,406,230 | 7.7% | -6.4% |
| 6 | Austria | 2,855 | 23,656,168 | -12.3% | -13.2% |
| 7 | India | 15,181 | 19,092,148 | -46.2% | -19.1% |
| 8 | Korea | 176,057 | 18,349,659 | 146.0% | 69.1% |
| 9 | Switzerland | 62,528 | 11,467,567 | 130.7% | 165.5% |
| 10 | Russian Federation | 11,192 | 7,904,770 | 23.1% | 57.6% |
| 11 | Spain | 28,297 | 6,893,590 | 33.3% | -38.4% |
| 12 | Hong Kong | 2,700 | 6,143,828 | -87.3% | 8.8% |
| 13 | Singapore | 934 | 4,696,444 | 141.3% | 65.2% |
| 14 | Brazil | 13,017 | 4,087,502 | -75.6% | -41.4% |
| 15 | United Kingdom | 79,212 | 3,853,573 | 163.6% | 121.5% |
| 16 | Canada | 89,341 | 3,567,104 | -24.9% | -33.3% |
| 17 | Turkey | 5,271 | 2,931,480 | 224.2% | 175.2% |
| 18 | Argentina | 12,801 | 2,884,536 | 145.6% | 396.3% |
| 19 | Netherlands | 13,457 | 2,693,464 | 85.4% | -5.4% |
| 20 | Mexico | 1,158 | 2,592,108 | -63.7% | 26.8% |
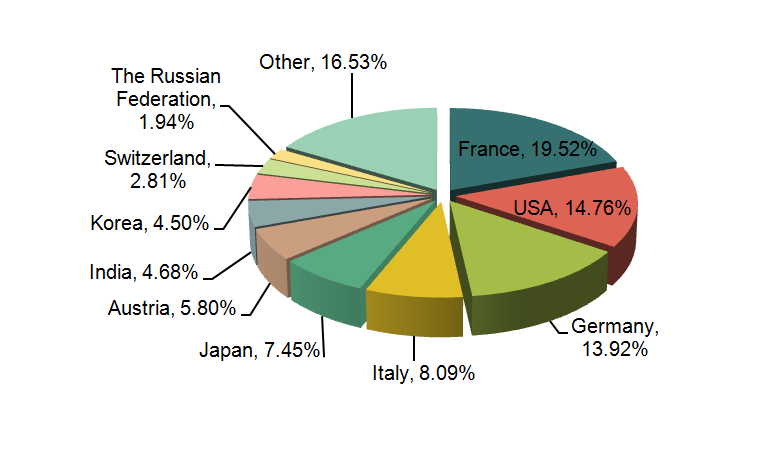
Chinese major exporting countries/regions of dried glands and other organs for organ therapeutic uses, extracts of glands or other organs, heparin and its salts, human or animal substances from Jan. to May. in 2013 were France, USA, Germany, Italy, Japan, Austria, India, Korea, Switzerland, the Russian Federation, etc. Among the top 20 exporting countries/regions, the countries whose exports increased by a big margin are: Italy (up 133.8%), Switzerland (up 165.5%), the UK (up 121.5%), Turkey (up 175.2%) and Argentina (up 396.3%).
Exporting Sources of Dried Glands and Other Organs for Organ Therapeutic Uses, Extracts of Glands or Other Organs, Heparin and Its Salts, Human or Animal Substances (HS: 3001) from Jan. to May. in 2013
| No. | Regions | Quantity (kg) | Amount (USD) | Year on Year | |
| Volume | Value | ||||
| 1 | Shandong | 1,442,588 | 146,320,845 | 13.0% | 16.9% |
| 2 | Guangdong | 21,004 | 109,324,381 | -15.1% | -8.1% |
| 3 | Jiangsu | 85,838 | 96,483,605 | -41.4% | -25.4% |
| 4 | Shanghai | 200,634 | 17,001,291 | 13.6% | -2.1% |
| 5 | Zhejiang | 79,951 | 16,050,433 | -70.4% | -26.5% |
| 6 | Hebei | 12,263 | 13,084,395 | -25.3% | 26.1% |
| 7 | Sichuan | 34,048 | 4,942,290 | -32.4% | 33.1% |
| 8 | Chongqing | 28,382 | 2,225,011 | 1.5% | -20.8% |
| 9 | Anhui | 21,014 | 1,299,240 | 300100.0% | 667.3% |
| 10 | Henan | 13,115 | 509,677 | -12.6% | -34.5% |
Shandong, Guangdong and Jiangsu are Chinese main exporting origins of dried glands and other organs for organ therapeutic uses, extracts of glands or other organs, heparin and its salts, human or animal substances; The largest increase in volume and value are in Anhui, with 300100.0% increase in exporting volume and 667.3% in exporting value.
Chinese Exports of Human Blood; Animal Blood; Antisera, Other Blood Fractions and Immunological Products; Vaccines, Toxins, Cultures of Microorganisms and Similar Products (HS: 3002) in 2013
Major Exporting Countries / Regions Distribution of Human Blood; Animal Blood; Antisera, Other Blood Fractions and Immunological Products; Vaccines, Toxins, Cultures of Microorganisms and Similar Products (HS: 3002) from Jan. to May. in 2013
| No. | Countries / Regions | Quantity (kg) | Amount (USD) | Year on Year | |
| Volume | Value | ||||
| 1 | USA | 1,093,603 | 30,632,980 | 51.7% | 71.1% |
| 2 | India | 191,155 | 10,071,574 | 38.6% | 115.7% |
| 3 | France | 119,743 | 4,996,168 | 19.4% | -1.4% |
| 4 | Vietnam | 134,487 | 4,765,215 | 53.3% | 189.7% |
| 5 | Germany | 98,461 | 4,274,554 | 36.3% | -22.4% |
| 6 | Thailand | 51,604 | 3,476,745 | 65.0% | 204.1% |
| 7 | Egypt | 116,881 | 2,916,705 | -26.8% | -37.7% |
| 8 | Turkey | 37,719 | 2,719,974 | -24.6% | -58.0% |
| 9 | Russian Federation | 22,431 | 2,455,784 | 8.3% | 88.2% |
| 10 | Poland | 60,399 | 2,423,050 | 361.4% | 1025.1% |
| 11 | Pakistan | 127,070 | 2,413,812 | -3.6% | -18.9% |
| 12 | United Kingdom | 88,423 | 2,341,841 | -19.9% | -5.8% |
| 13 | Brazil | 25,909 | 1,987,381 | 6.0% | 223.0% |
| 14 | Japan | 77,960 | 1,901,021 | 254.9% | 44.6% |
| 15 | Hong Kong | 17,506 | 1,866,167 | 74.8% | 8.1% |
| 16 | Philippine | 44,804 | 1,762,483 | 7.8% | 56.6% |
| 17 | Ethiopia | 79,108 | 1,692,494 | 531.1% | 231.8% |
| 18 | Ireland | 66,590 | 1,563,002 | 27.8% | 43.6% |
| 19 | Mexico | 18,230 | 1,540,081 | 59.1% | 1110.8% |
| 20 | Columbia | 33,704 | 1,443,623 | 123.5% | -4.3% |
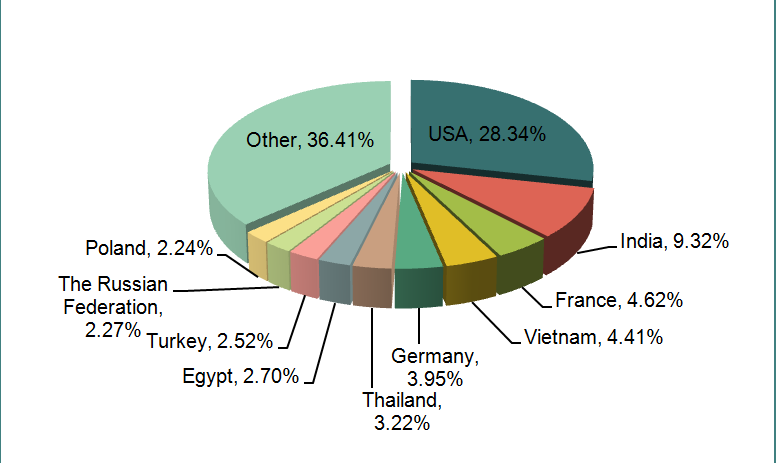
Chinese major exporting countries/regions of human blood; animal blood; antisera, other blood fractions and immunological products; vaccines, toxins, cultures of microorganisms and similar products from Jan. to May. in 2013 were USA, India, France, Vietnam, Germany, Thailand, Egypt, Turkey, the Russian Federation, Poland, etc. Among the top 20 exporting countries/regions, the countries whose exports increased by a big margin are: India (up 115.7%), Vietnam (up 189.7%), Thailand (up 204.1%), Poland (an increase of 1025.1%), Brazil (up 223.0%), Ethiopia (up 231.8%) and Mexico (an increase of 1110.8%).
Exporting Sources of Human Blood; Animal Blood; Antisera, Other Blood Fractions and Immunological Products; Vaccines, Toxins, Cultures of Microorganisms and Similar Products (HS: 3002) from Jan. to May. in 2013
| No. | Regions | Quantity (kg) | Amount (USD) | Year on Year | |
| Volume | Value | ||||
| 1 | Zhejiang | 1,907,470 | 40,373,892 | 24.8% | 22.6% |
| 2 | Shanghai | 459,547 | 23,064,749 | 422.7% | 100.2% |
| 3 | Sichuan | 22,610 | 10,234,430 | 63.8% | 38.3% |
| 4 | Beijing | 167,941 | 8,183,659 | -9.8% | -4.3% |
| 5 | Liaoning | 150,431 | 6,064,993 | 8.2% | 43.4% |
| 6 | Jiangsu | 167,168 | 3,814,474 | 28.4% | 10.8% |
| 7 | Guangdong | 76,121 | 3,504,272 | 108.1% | 404.4% |
| 8 | Fujian | 185,925 | 3,315,195 | -3.2% | -1.9% |
| 9 | Shandong | 157,074 | 2,584,051 | -21.8% | 40.7% |
| 10 | Hubei | 23,352 | 1,379,713 | 62.7% | 14.8% |
Zhejiang and Shanghai are Chinese main exporting origins of human blood; animal blood; antisera, other blood fractions and immunological products; vaccines, toxins, cultures of microorganisms and similar products; The largest increase in volume and value are in Shanghai and Guangdong; Total export volume of Shanghai increased by 422.7% from Jan. to May., with 100.2% increase in value. Over the same period, Guangdong's export volume increased by 108.1%, with 404.4% increase in value.
Chinese Exports of Medicaments Consisting of Two or More Constituents Which Have Been Mixed Together for Therapeutic or Prophylactic Uses, not Put Up in Measured Doses or in Forms of Packing for Retail Sale (HS: 3003) in 2013
Major Exporting Countries / Regions Distribution of Medicaments Consisting of Two or More Constituents Which Have Been Mixed Together for Therapeutic or Prophylactic Uses, not Put Up in Measured Doses or in Forms of Packing for Retail Sale (HS: 3003) from Jan. to May. in 2013
| No. | Countries / Regions | Quantity (kg) | Amount (USD) | Year on Year | |
| Volume | Value | ||||
| 1 | India | 2,239,900 | 29,295,162 | 31.4% | 21.6% |
| 2 | USA | 3,933,019 | 20,610,345 | 0.6% | -14.0% |
| 3 | Japan | 227,946 | 19,185,855 | -33.9% | -33.5% |
| 4 | Brazil | 4,026,209 | 15,183,725 | -24.0% | -23.9% |
| 5 | Iran | 158,238 | 9,312,227 | 29.5% | 788.0% |
| 6 | Spain | 141,178 | 9,138,513 | -21.3% | 30.5% |
| 7 | Germany | 175,361 | 8,017,098 | 37.0% | 26.2% |
| 8 | Venezuela | 30,217 | 7,861,747 | -89.3% | 1187.8% |
| 9 | Korea | 562,433 | 7,287,477 | 37.4% | 68.0% |
| 10 | Hong Kong | 101,151 | 7,200,619 | -38.8% | -35.3% |
| 11 | Turkey | 23,704 | 5,657,995 | 53.8% | 42.9% |
| 12 | Mexico | 869,460 | 4,915,505 | 50.8% | 45.1% |
| 13 | Greece | 1,712,988 | 4,530,420 | -35.5% | -28.6% |
| 14 | Greece | 102,030 | 4,399,092 | -65.7% | -27.9% |
| 15 | Pakistan | 918,412 | 4,344,428 | 623.1% | 82.2% |
| 16 | Columbia | 718,586 | 4,044,656 | -22.8% | -13.1% |
| 17 | Thailand | 691,734 | 3,606,480 | -31.4% | -19.2% |
| 18 | Argentina | 741,440 | 3,434,658 | 17.2% | 51.5% |
| 19 | Egypt | 196,987 | 3,411,139 | 74.3% | 51.5% |
| 20 | France | 25,090 | 3,142,794 | -50.0% | -27.5% |
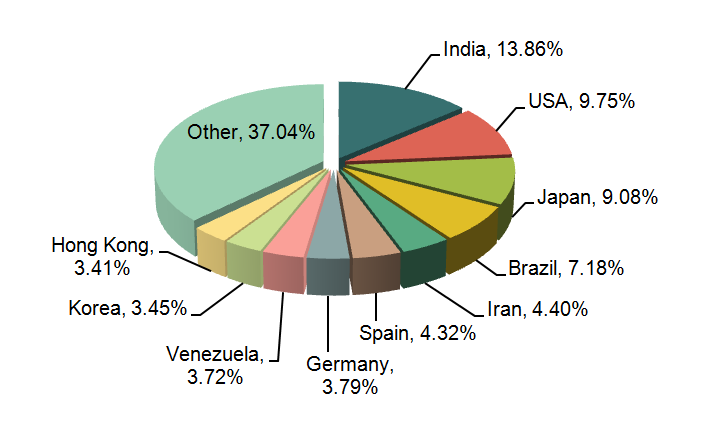
Chinese major exporting countries/regions of medicaments consisting of two or more constituents which have been mixed together for therapeutic or prophylactic uses, not put up in measured doses or in forms of packing for retail sale from Jan. to May. in 2013 were India, USA, Japan, Brazil, Iran, Spain, Germany, Venezuela, Korea, Hong Kong, etc. Among the top 20 exporting countries/regions, the countries whose exports increased by a big margin are: Iran (an increase of 788%) and Venezuela (an increase of 1187.8%).
Exporting Sources of Medicaments Consisting of Two or More Constituents Which Have Been Mixed Together for Therapeutic or Prophylactic Uses, not Put Up in Measured Doses or in Forms of Packing for Retail Sale (HS: 3003) from Jan. to May. in 2013
| No. | Regions | Quantity (kg) | Amount (USD) | Year on Year | |
| Volume | Value | ||||
| 1 | Shandong | 11,439,217 | 71,089,846 | 0.9% | 6.5% |
| 2 | Zhejiang | 3,794,650 | 39,162,290 | -32.2% | -3.2% |
| 3 | Guangdong | 256,453 | 17,114,844 | 62.3% | 14.6% |
| 4 | Shanxi | 230,506 | 13,982,984 | 7.5% | 6.3% |
| 5 | Tianjin | 141,098 | 12,432,925 | 25.0% | -45.5% |
| 6 | Fujian | 4,829,102 | 12,390,318 | 1.6% | 7.5% |
| 7 | Jiangsu | 1,484,386 | 8,444,115 | 21.6% | 17.7% |
| 8 | Liaoning | 25,851 | 8,037,073 | -63.3% | 5.7% |
| 9 | Hebei | 492,471 | 7,830,715 | 8.0% | 88.2% |
| 10 | Beijing | 34,142 | 4,802,330 | -64.7% | 296.6% |
Shandong and Zhejiang are Chinese main exporting origins of medicaments consisting of two or more constituents who have been mixed together for therapeutic or prophylactic uses, not put up in measured doses or in forms of packing for retail sale. The largest increase is in Beijing, with an increase of 296.6%.
Chinese Exports of Medicaments Consisting of Mixed or Unmixed Products for Therapeutic or Prophylactic Uses, Put Up in Measured Doses or In Forms of Packing for Retail Sale (HS: 3004) in 2013
Major Exporting Countries / Regions Distribution of Medicaments Consisting of Mixed or Unmixed Products for Therapeutic or Prophylactic Uses, Put Up in Measured Doses or In Forms of Packing for Retail Sale (HS: 3004) from Jan. to May. in 2013
| No. | Countries / Regions | Quantity (kg) | Amount (USD) | Year on Year | |
| Volume | Value | ||||
| 1 | Australia | 1,226,769 | 246,353,453 | 24.5% | 6.2% |
| 2 | Korea | 587,344 | 85,069,742 | 21.0% | -0.1% |
| 3 | Hong Kong | 5,518,317 | 79,980,388 | -4.9% | 5.3% |
| 4 | Nigeria | 5,211,933 | 43,361,519 | 48.9% | 45.2% |
| 5 | Malaysia | 633,070 | 29,777,215 | 48.2% | 67.3% |
| 6 | USA | 2,808,336 | 28,899,448 | 19.5% | 15.1% |
| 7 | Luxembourg | 19,385 | 27,539,955 | 0.0% | 0.0% |
| 8 | Philippine | 2,563,838 | 22,818,729 | -10.6% | 39.7% |
| 9 | United Kingdom | 1,704,281 | 22,547,242 | 2.3% | -20.3% |
| 10 | Singapore | 529,806 | 19,630,790 | 5.6% | 10.4% |
| 11 | France | 423,438 | 17,567,934 | 19.2% | -35.5% |
| 12 | Denmark | 107,621 | 16,958,586 | 465.0% | 8443.5% |
| 13 | Netherlands | 1,920,033 | 16,086,093 | -2.5% | 11.5% |
| 14 | Vietnam | 5,670,590 | 15,547,163 | 99.7% | 7.7% |
| 15 | Pakistan | 2,621,978 | 15,505,994 | -6.2% | -6.0% |
| 16 | Belgium | 529,749 | 14,385,323 | -19.8% | -24.4% |
| 17 | Sudan | 1,525,323 | 13,504,563 | 57.7% | 66.3% |
| 18 | Sweden | 828,698 | 13,150,810 | 1286.7% | 66.6% |
| 19 | Japan | 372,918 | 11,693,392 | -30.0% | -36.4% |
| 20 | Kenya | 1,368,128 | 11,439,887 | 21.0% | 62.4% |
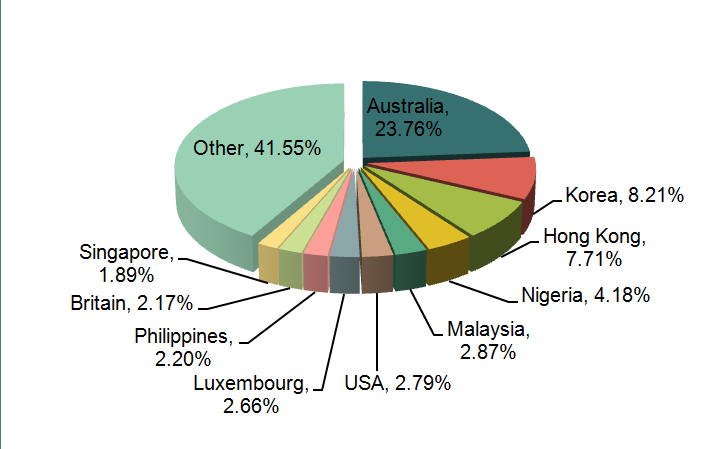
Chinese major exporting countries/regions of medicaments consisting of mixed or unmixed products for therapeutic or prophylactic uses put up in measured doses or In forms of packing for retail sale from Jan. to May. in 2013 were Australia, Korea, Hong Kong, Nigeria, Malaysia, USA, Luxembourg, Philippine, United Kingdom and Singapore. Among the top 20 exporting countries/regions, the largest increase in exporting value is in Denmark, with an increase of 8443.5%.
Exporting Sources of Medicaments Consisting of Medicaments Consisting of Mixed or Unmixed Products for Therapeutic or Prophylactic Uses, Put Up in Measured Doses or In Forms of Packing for Retail Sale (HS: 3004) from Jan. to May. in 2013
| No. | Regions | Quantity (kg) | Amount (USD) | Year on Year | |
| Volume | Value | ||||
| 1 | Shanghai | 7,002,711 | 412,926,819 | 15.1% | 9.3% |
| 2 | Jiangsu | 12,766,566 | 147,017,539 | 18.6% | -1.8% |
| 3 | Hebei | 22,901,167 | 91,992,544 | 38.7% | 27.8% |
| 4 | Guangdong | 8,361,262 | 57,131,182 | -4.9% | 13.9% |
| 5 | Zhejiang | 6,625,766 | 55,660,647 | 14.6% | 36.0% |
| 6 | Tianjin | 1,016,069 | 45,790,756 | 6.1% | 40.1% |
| 7 | Shandong | 6,053,511 | 44,745,602 | -4.0% | 0.1% |
| 8 | Fujian | 146,776 | 25,243,986 | -7.2% | 41.6% |
| 9 | Liaoning | 628,663 | 23,362,178 | -44.3% | -32.6% |
| 10 | Beijing | 1,029,653 | 23,077,859 | -20.4% | -46.4% |
Shanghai and Jiangsu are Chinese main exporting origins of medicaments consisting of mixed or unmixed products for therapeutic or prophylactic uses, put up in measured doses or In forms of packing for retail sale.
Chinese Exports of Medicaments Consisting of Wadding, Gauze, Bandages and Similar Articles (HS: 3005) in 2013
Major Exporting Countries / Regions Distribution of Wadding, Gauze, Bandages and Similar Articles (HS: 3005) from Jan. to May. in 2013
| No. | Countries / Regions | Quantity (kg) | Amount (USD) | Year on Year | |
| Volume | Value | ||||
| 1 | USA | 17,167,608 | 119,979,252 | 9.3% | 3.6% |
| 2 | Japan | 4,657,183 | 47,042,793 | 2.1% | -2.0% |
| 3 | Germany | 5,319,572 | 44,140,926 | 35.2% | 24.0% |
| 4 | United Kingdom | 2,494,304 | 30,476,096 | -4.4% | 4.7% |
| 5 | France | 2,844,363 | 16,407,167 | -9.2% | -15.9% |
| 6 | Italy | 2,497,966 | 16,193,442 | -17.1% | -24.2% |
| 7 | Venezuela | 949,517 | 15,431,358 | 77.9% | 277.9% |
| 8 | Australia | 1,425,595 | 13,055,648 | 14.2% | 8.2% |
| 9 | Saudi Arabia | 1,753,113 | 12,632,365 | 21.3% | 18.2% |
| 10 | Korea | 1,742,111 | 12,188,243 | -5.0% | 3.8% |
| 11 | Netherlands | 1,710,622 | 12,104,714 | 60.8% | 55.4% |
| 12 | Belgium | 1,578,661 | 11,346,427 | -38.5% | -43.8% |
| 13 | Canada | 1,170,996 | 8,306,360 | -8.7% | -8.4% |
| 14 | Taiwan | 1,063,030 | 6,795,200 | 11.4% | 8.3% |
| 15 | Malaysia | 976,866 | 6,751,592 | 6.9% | 16.2% |
| 16 | The Russian Federation | 919,398 | 6,485,973 | 18.7% | 17.8% |
| 17 | South Africa | 932,519 | 5,908,431 | 10.9% | -3.1% |
| 18 | Hong Kong | 637,561 | 5,868,253 | -35.8% | -14.5% |
| 19 | Brazil | 698,394 | 5,502,742 | 123.6% | 84.7% |
| 20 | Spain | 780,630 | 5,020,510 | -4.5% | -11.2% |
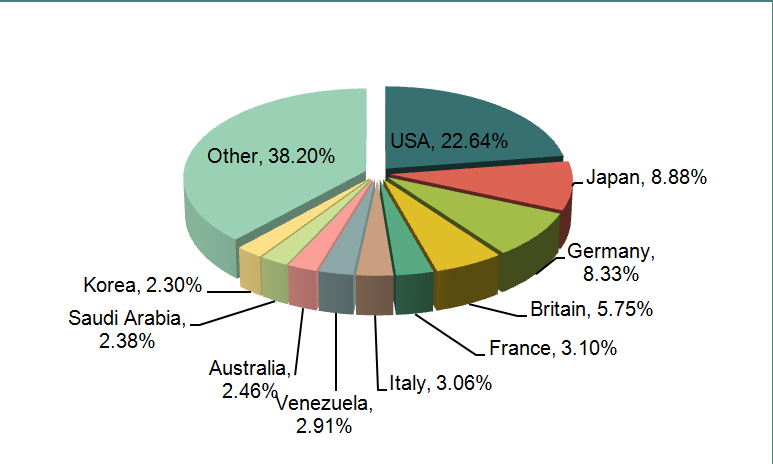
Chinese major exporting countries/regions of medicaments consisting of wadding, gauze, bandages and similar articles from Jan. to May. in 2013 were USA, Japan, Germany, United Kingdom, France, Italy, Venezuela, Australia, Saudi Arabia and Korea. Among the top 20 exporting countries/regions, the largest increase in exporting value is in Venezuela, with an increase of 277.9%.
Exporting Sources of Medicaments Consisting of Wadding, Gauze, Bandages and Similar Articles (HS: 3005) from Jan. to May. in 2013
| No. | Regions | Quantity (kg) | Amount (USD) | Year on Year | |
| Volume | Value | ||||
| 1 | Jiangsu | 18,265,597 | 149,245,463 | 4.9% | 4.5% |
| 2 | Zhejiang | 19,507,994 | 106,713,763 | 7.5% | -1.2% |
| 3 | Hubei | 15,894,155 | 105,977,959 | 11.2% | 2.8% |
| 4 | Shanghai | 7,130,055 | 63,709,387 | 6.0% | 1.5% |
| 5 | Guangdong | 3,888,677 | 39,337,921 | -8.9% | 4.0% |
| 6 | Shandong | 2,848,809 | 25,552,626 | -4.4% | -13.7% |
| 7 | Hebei | 389,192 | 6,312,778 | -36.3% | 137.9% |
| 8 | Jiangxi | 701,162 | 5,863,321 | 52.9% | 36.8% |
| 9 | Anhui | 1,132,048 | 5,178,675 | 20.3% | 27.1% |
| 10 | Tianjin | 811,788 | 4,932,941 | -29.4% | -15.9% |
Jiangsu, Zhejiang and Hubei are Chinese main exporting origins of medicaments consisting of wadding, gauze, bandages and similar articles.
1.6.Chinese Exports of Hemostatic Material, Blood Reagents, X-ray Contrast Agent, Bone Cements, First Aid Kit, Birth Control Pills, Gels and Other Products, and Waste Pharmaceuticals, etc (HS: 3006) in 2013
Major Exporting Countries / Regions Distribution of Hemostatic material, blood reagents, X-ray contrast agent, bone cements, first aid kit, birth control pills, gels and other products, and waste pharmaceuticals, etc (HS: 3006) from Jan. to May. in 2013
| No. | Countries / Regions | Quantity (kg) | Amount (USD) | Year on Year | |
| Volume | Value | ||||
| 1 | USA | 2,213,165 | 131,570,976 | 6.0% | 61.7% |
| 2 | Ireland | 253,089 | 26,521,117 | -17.1% | -7.6% |
| 3 | Germany | 2,171,385 | 13,040,697 | 22.1% | 13.8% |
| 4 | India | 143,562 | 12,871,333 | -26.2% | 36.5% |
| 5 | Canada | 162,794 | 11,497,369 | 14.7% | 138.2% |
| 6 | Australia | 664,007 | 10,381,683 | 7.1% | 24.4% |
| 7 | Brazil | 103,016 | 7,462,889 | -32.2% | -22.4% |
| 8 | United Kingdom | 1,065,839 | 7,026,206 | 4.2% | 9.3% |
| 9 | Hong Kong | 89,971 | 2,629,255 | -19.6% | -28.7% |
| 10 | Saudi Arabia | 360,167 | 2,179,765 | 357.5% | 369.2% |
| 11 | New Zealand | 69,962 | 1,990,079 | -20.2% | -11.2% |
| 12 | Netherlands | 228,391 | 1,805,523 | 29.3% | 7.2% |
| 13 | Singapore | 49,602 | 1,675,581 | 7.8% | 11.8% |
| 14 | Thailand | 31,339 | 1,671,116 | 76.5% | 152.5% |
| 15 | Malaysia | 78,309 | 1,221,188 | -13.6% | 5.1% |
| 16 | Denmark | 148,019 | 1,105,109 | 15.7% | -2.7% |
| 17 | Belgium | 129,750 | 1,078,851 | 45.7% | 37.5% |
| 18 | Cuba | 26,074 | 1,047,013 | 30940.5% | 15941.3% |
| 19 | Hungary | 28,035 | 1,005,305 | -71.6% | -64.7% |
| 20 | Kenya | 57,911 | 976,981 | 142.9% | 66.2% |
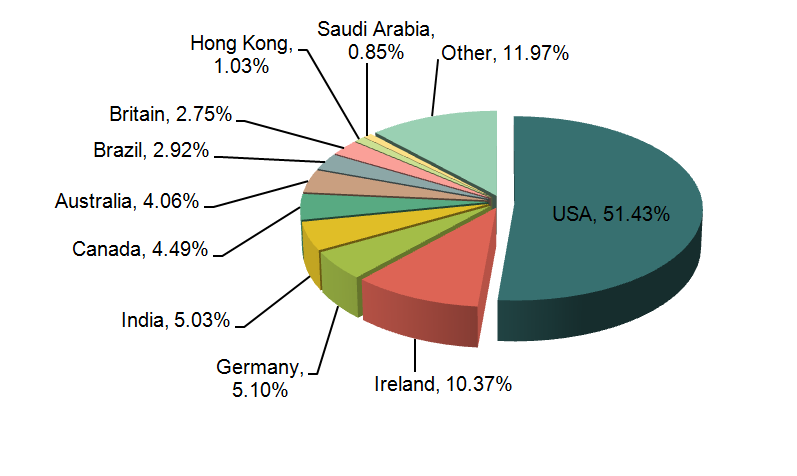
Chinese major exporting countries/regions of hemostatic material, blood reagents, X-ray contrast agent, bone cements, first aid kit, birth control pills, gels and other products, and waste pharmaceuticals, etc. from Jan. to May. in 2013 were USA, Ireland, Germany, India, Canada, Australia, Brazil, United Kingdom, Hong Kong and Saudi Arabia. Among the top 20 exporting countries/regions, the countries whose exports increased by a big margin are: Canada (an increase of 138.2 percent), Saudi Arabia (up 369.2%), Thailand (up 152.5%) and Cuba (an increase of 15,941.3%) .
Exporting Sources of Medicaments Consisting of Hemostatic material, blood reagents, X-ray contrast agent, bone cements, first aid kit, birth control pills, gels and other products, and waste pharmaceuticals, etc (HS: 3006) from Jan. to May. in 2013
| No. | Regions | Quantity (kg) | Amount (USD) | Year on Year | |
| Volume | Value | ||||
| 1 | Shanghai | 2,622,742 | 197,395,556 | 6.0% | 40.2% |
| 2 | Zhejiang | 1,836,618 | 13,926,415 | 28.3% | 17.0% |
| 3 | Jiangsu | 1,777,332 | 13,809,657 | 13.1% | 44.7% |
| 4 | Hubei | 1,500,875 | 9,048,559 | 13.4% | 8.1% |
| 5 | Guangdong | 1,212,503 | 8,819,445 | -0.6% | -21.4% |
| 6 | Beijing | 276,959 | 4,158,642 | 8.2% | 11.5% |
| 7 | Tianjin | 108,948 | 3,163,708 | 7.1% | -12.1% |
| 8 | Fujian | 248,633 | 2,198,766 | -22.6% | 0.4% |
| 9 | Shandong | 36,385 | 1,961,258 | -16.7% | 40.3% |
| 10 | Jilin | 21,971 | 476,972 | 160.8% | 164.3% |
Shanghai, Zhejiang and Jiangsu are Chinese main exporting origins of hemostatic material, blood reagents, X-ray contrast agent, bone cements, first aid kit, birth control pills, gels and other products, and waste pharmaceuticals, etc..
Source: Customs Information Website


