2009-2012 Global Demand of Valve Industry Analysis
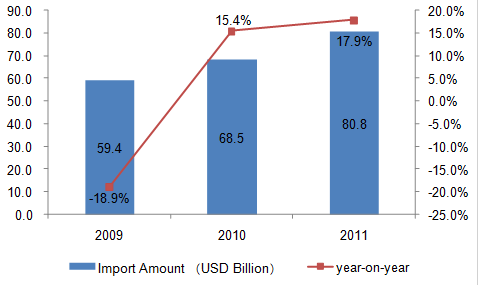
2009-2011 Global Valve(HS:8481)Demand Trend
Jan.-Nov. 2012 Global Valve(HS:8481)Major Import Countries/Regions
| Item | Countries/Regions | Import Amount (USD Thousand) Jan.-Sep. 2012 | Proportion of last year (the same period) |
| 1 | USA | 10,224,870 | 14.75% |
| 2 | China | 5,484,418 | -2.88% |
| 3 | Germany | 2,738,237 | -35.80% |
| 4 | Canada | 2,737,459 | 15.90% |
| 5 | The United Kingdom | 2,387,736 | 0.75% |
| 6 | France | 2,266,921 | -2.56% |
| 7 | Russian Federation | 2,222,206 | 45.62% |
| 8 | Japan | 1,684,072 | 4.66% |
| 9 | Republic of Korea | 1,654,316 | 16.33% |
| 10 | Mexico | 1,298,269 | -28.40% |
From 2009 to 2011, valves global import amount appear an upward trend,besides, the import amount in 2011 reached an increase of 17.9% than in 2010.
From Jan. to Sep. in 2012, the main importing countries of the valve are the United States, China, Germany, Canada, the United Kingdom, France, the Russian Federation, Japan, South Korea, Mexico and etc.
Source:UN COMTRADE


