2010-2012 Japan Battery Import Trend
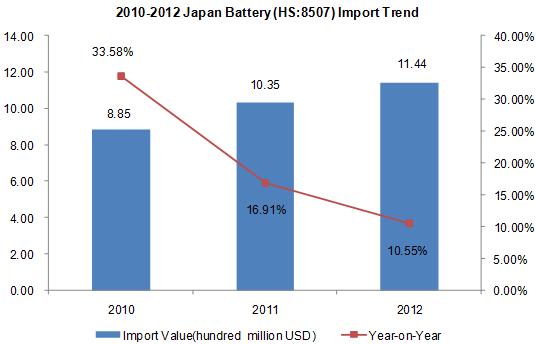
From 2010 to 2012, Japan battery import value showed an increasing trend year by year, the total import value in 2012 was approximately $ 1.144 billion, an increase of 10.55% compared with the same period in 2011.
2010-2012 Japan Battery Import Market Analysis
| No. | Import Country/ Region | Import Value(Thousand USD) | Import Value Growth Compared 2012 with 2010 | ||
| 2010 | 2011 | 2012 | |||
| 1 | China | 432,502 | 523,134 | 605,701 | 40.05% |
| 2 | Republic of Korea | 154,617 | 212,020 | 236,452 | 52.93% |
| 3 | USA | 87,942 | 101,671 | 89,504 | 1.78% |
| 4 | Chinese Taipei | 67,169 | 65,396 | 56,885 | -15.31% |
| 5 | United Kingdom | 7,699 | 11,955 | 36,599 | 375.37% |
| 6 | Philippines | 46,383 | 29,235 | 24,300 | -47.61% |
| 7 | Indonesia | 15,807 | 19,980 | 21,319 | 34.87% |
| 8 | Germany | 15,679 | 18,916 | 19,894 | 26.88% |
| 9 | Thailand | 15,384 | 12,947 | 12,329 | -19.86% |
| 10 | France | 8,070 | 6,548 | 7,582 | -6.05% |
| 11 | Singapore | 2,611 | 4,581 | 7,254 | 177.82% |
| 12 | Spain | 8,696 | 7,148 | 5,674 | -34.75% |
| 13 | Italy | 3,404 | 3,116 | 3,267 | -4.02% |
| 14 | Vietnam | 1,378 | 1,996 | 2,091 | 51.74% |
| 15 | Mexico | 2,487 | 1,894 | 1,893 | -23.88% |
| 16 | Malaysia | 2,289 | 2,471 | 1,888 | -17.52% |
| 17 | Poland | 1,527 | 1,829 | 1,784 | 16.83% |
| 18 | Hong Kong | 3,689 | 1,486 | 1,267 | -65.65% |
| 19 | Czech Republic | 1,253 | 1,193 | 1,116 | -10.93% |
| 20 | Australia | 279 | 214 | 1,049 | 275.99% |
From 2010 to 2012, China, Republic of Korea and the USA were the top three largest import markets for Japan battery. Among the top twenty battery export markets in 2012, the import values from United Kingdom, Singapore and Australia of battery increased the most, 375.37%, 177.82% and 275.99% compared to that of 2010.
2010-2012 Japan Battery Import Market Share Analysis
| No. | Import Country/ Region | Import Value Percentage | ||
| 2010 | 2011 | 2012 | ||
| 1 | China↑ | 48.85% | 50.54% | 52.93% |
| 2 | Republic of Korea↑ | 17.46% | 20.48% | 20.66% |
| 3 | USA↓ | 9.93% | 9.82% | 7.82% |
| 4 | Chinese Taipei↓ | 7.59% | 6.32% | 4.97% |
| 5 | United Kingdom↑ | 0.87% | 1.15% | 3.20% |
| 6 | Philippines↓ | 5.24% | 2.82% | 2.12% |
| 7 | Indonesia | 1.79% | 1.93% | 1.86% |
| 8 | Germany | 1.77% | 1.83% | 1.74% |
| 9 | Thailand↓ | 1.74% | 1.25% | 1.08% |
| 10 | France | 0.91% | 0.63% | 0.66% |
| 11 | Singapore↑ | 0.29% | 0.44% | 0.63% |
| 12 | Spain↓ | 0.98% | 0.69% | 0.50% |
| 13 | Italy↓ | 0.38% | 0.30% | 0.29% |
| 14 | Vietnam | 0.16% | 0.19% | 0.18% |
| 15 | Mexico↓ | 0.28% | 0.18% | 0.17% |
| 16 | Malaysia↓ | 0.26% | 0.24% | 0.16% |
| 17 | Poland | 0.17% | 0.18% | 0.16% |
| 18 | Hong Kong↓ | 0.42% | 0.14% | 0.11% |
| 19 | Czech Republic↓ | 0.14% | 0.12% | 0.10% |
| 20 | Australia | 0.03% | 0.02% | 0.09% |
Note: “↑”represents that the indicators listed, continued to increase from 2010 to 2012, “↓”represents that the indicators listed, continued to decrease from 2010 to 2012.
From three years of market proportion, the import value proportion of China, Republic of Korea, United Kingdom and Singapore continued to rise; the country which continued to decline includes the USA, Chinese Taipei, Philippines, Thailand, Spain, Italy, Mexico, Malaysia, Hong Kong and Czech Republic.
Japan Battery Import Situation from Jan. to Dec. 2013
| Country/ Region | Total Import Value from Jan. to Dec.2013(Thousand USD) | Year on Year | Percentage |
| Total | 1,153,085 | 0.76% | 100.00% |
| China | 629,677 | 3.96% | 54.61% |
| Republic of Korea | 233,055 | -1.44% | 20.21% |
| USA | 63,976 | -28.52% | 5.55% |
| Turkey | 45,244 | 96163.83% | 3.92% |
| Chinese Taipei | 40,324 | -29.11% | 3.50% |
| Germany | 21,661 | 8.88% | 1.88% |
| Indonesia | 21,554 | 1.10% | 1.87% |
| Singapore | 17,111 | 135.88% | 1.48% |
| Thailand | 13,255 | 7.51% | 1.15% |
| Philippines | 12,999 | -46.51% | 1.13% |
Judging from the statistics of Jan. to Dec. 2013, the total import value of Japan battery amounted to approximately $ 11.53, an increase of 0.76%.And China was the largest original country of Japan battery import, accounting for 54.61% of total import value, followed by Republic of Korea, accounting for 20.21% of total imports.
(Source:UN COMTRADE)


