Germany Bags, Cases & Boxes Import Value Annual Trend from 2010 to 2012
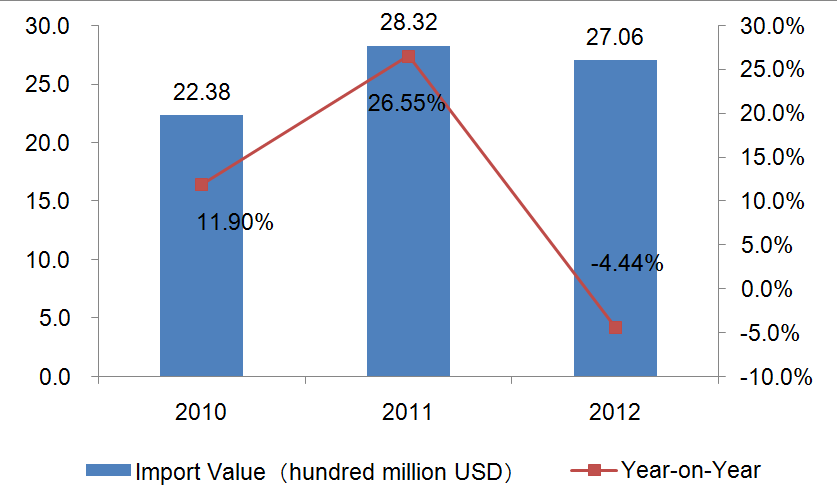
The import value of Germany bags, cases & boxes showed an inverted "V" trend from 2010 to 2012. The import value of the three years amounted to 2.238 billion US dollars (with an increase of 11.9% year on year), 2.832 billion US dollars (with an increase of 26.55% year on year) and 2.706 billion US dollars (with a decrease of 4.44% year on year).
Germany Bags, Cases & Boxes Major Sourcing Countries/Regions from 2010 to 2012
(Unit: Thousand USD)
| Countries/Regions | 2010 | 2011 | 2012 |
| China | 1,298,651 | 1,482,573 | 1,402,566 |
| Italy | 131,675 | 207,423 | 257,370 |
| France | 123,998 | 172,012 | 172,154 |
| India | 131,564 | 169,451 | 160,640 |
| Vietnam | 117,095 | 142,428 | 149,034 |
| Netherlands | 50,602 | 135,013 | 70,837 |
| Belgium | 45,816 | 51,894 | 46,402 |
| Switzerland | 51,262 | 82,618 | 45,732 |
| Czech | 28,592 | 40,380 | 44,468 |
| Hong Kong | 29,432 | 45,479 | 39,577 |
| Thailand | 28,385 | 34,793 | 35,589 |
| UK | 34,638 | 41,784 | 35,568 |
| Spain | 26,322 | 32,657 | 32,596 |
| Turkey | 18,396 | 18,978 | 21,055 |
| USA | 13,392 | 15,776 | 18,410 |
| Poland | 10,929 | 16,432 | 17,420 |
| Ireland | 4,833 | 13,844 | 16,354 |
| Indonesia | 10,205 | 16,663 | 15,011 |
| Romania | 5,796 | 10,657 | 13,291 |
| Hungary | 6,522 | 10,517 | 12,126 |
China is Germany bags, cases & boxes major sourcing country. Germany’s import value of bags, cases & boxes from China amounted to 1.4 billion US dollars in 2012, followed by Italy, the second largest import sourcing country, with import value of 0.26 billion US dollars. China's competitive advantage is obvious.
Germany Bags, Cases & Boxes Major Sourcing Countries/Regions Market Share Trend from 2010 to 2012
| Countries/Regions | 2010 | 2011 | 2012 |
| China↓ | 58.03% | 52.35% | 51.83% |
| Italy↑ | 5.88% | 7.32% | 9.51% |
| France↑ | 5.54% | 6.07% | 6.36% |
| India | 5.88% | 5.98% | 5.94% |
| Vietnam | 5.23% | 5.03% | 5.51% |
| Netherlands | 2.26% | 4.77% | 2.62% |
| Belgium↓ | 2.05% | 1.83% | 1.71% |
| Switzerland | 2.29% | 2.92% | 1.69% |
| Czech↑ | 1.28% | 1.43% | 1.64% |
| Hong Kong | 1.32% | 1.61% | 1.46% |
| Thailand | 1.27% | 1.23% | 1.32% |
| UK↓ | 1.55% | 1.48% | 1.31% |
| Spain | 1.18% | 1.15% | 1.20% |
| Turkey | 0.82% | 0.67% | 0.78% |
| USA | 0.60% | 0.56% | 0.68% |
| Poland↑ | 0.49% | 0.58% | 0.64% |
| Ireland↑ | 0.22% | 0.49% | 0.60% |
| Indonesia | 0.46% | 0.59% | 0.55% |
| Romania↑ | 0.26% | 0.38% | 0.49% |
| Hungary↑ | 0.29% | 0.37% | 0.45% |
Note: “↑”represents that the indicators listed continued to increase from 2010 to 2012, “↓”represents that the indicators listed continued to decrease from 2010 to 2012.
Judging from the import market share trend, the market share of Italy, France, Czech, Poland, Ireland, Romania and Hungary continued to increase while that of China, Belgium and United Kingdom continued to decrease from 2010 to 2012.
Germany Cartons, Boxes, Cases, Bags and Other Packing Containers, of Paper, Paperboard, Cellulose Wadding or Webs of Cellulose Fibers; Box Files, Letter Trays and Similar Articles, of Paper or Paperboard of a Kind Used in Offices, Shops or The Like (HS: 4819) Industry Imports from 2010 to 2012
Germany Cartons, Boxes, Cases, Bags and Other Packing Containers, of Paper, Paperboard, Cellulose Wadding or Webs of Cellulose Fibers; Box Files, Letter Trays and Similar Articles, of Paper or Paperboard of a Kind Used in Offices, Shops or the Like Import Value Annual Trend from 2010 to 2012
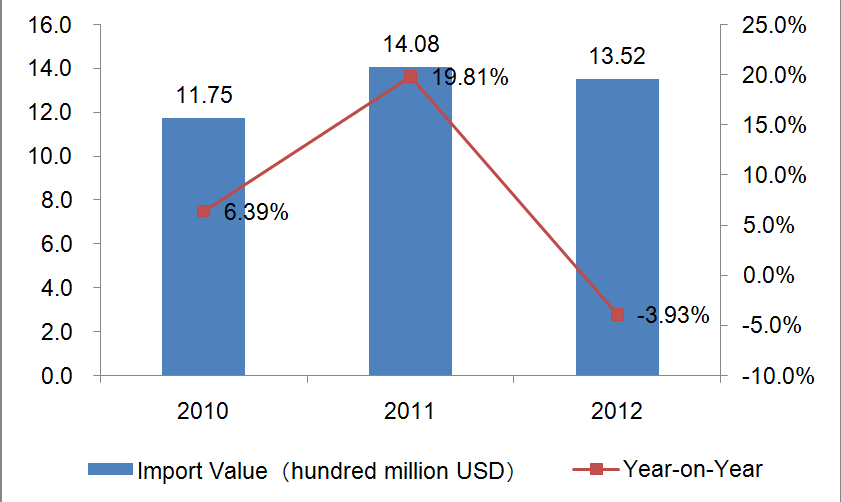
The import value of Germany cartons, boxes, cases, bags and other packing containers, of paper, paperboard, cellulose wadding or webs of cellulose fibers; box files, letter trays and similar articles, of paper or paperboard of a kind used in offices, shops or the like amounted to about 1.352 billion US dollars, with a decrease of 3.93% year on year in 2012.
Germany Cartons, Boxes, Cases, Bags and Other Packing Containers, of Paper, Paperboard, Cellulose Wadding or Webs of Cellulose Fibers; Box Files, Letter Trays and Similar Articles, of Paper or Paperboard of a Kind Used in Offices, Shops or the Like Major Sourcing Countries/Regions from 2010 to 2012
(Unit: Thousand USD)
| Countries/Regions | 2010 | 2011 | 2012 |
| Austria | 188,291 | 219,392 | 208,199 |
| Netherlands | 143,300 | 162,694 | 156,025 |
| China | 126,255 | 150,350 | 147,540 |
| Switzerland | 119,930 | 135,050 | 130,514 |
| Italy | 114,506 | 140,327 | 127,425 |
| Poland | 94,461 | 119,807 | 106,348 |
| France | 82,216 | 100,949 | 105,398 |
| Czech | 91,672 | 107,873 | 95,957 |
| Denmark | 15,217 | 20,143 | 37,261 |
| UK | 29,547 | 41,313 | 37,033 |
| Sweden | 31,660 | 40,537 | 32,774 |
| Belgium | 27,896 | 33,391 | 30,123 |
| Hungary | 11,285 | 23,390 | 25,733 |
| Turkey | 20,955 | 24,591 | 23,151 |
| Spain | 13,993 | 20,734 | 17,446 |
| USA | 9,004 | 9,396 | 11,804 |
| Lithuania | 9,853 | 10,594 | 11,378 |
| Finland | 4,641 | 5,637 | 4,033 |
| Ireland | 2,202 | 3,010 | 3,908 |
| Hong Kong | 6,155 | 5,499 | 3,691 |
Germany cartons, boxes, cases, bags and other packing containers, of paper, paperboard, cellulose wadding or webs of cellulose fibers; box files, letter trays and similar articles, of paper or paperboard of a kind used in offices, shops or the like major sourcing Countries are Austria, the Netherlands, China, Switzerland, and Italy, etc. Germany's import value of the product from China in 2012 amounted to 150 million dollars, with a decrease of 1.87% year on year.
Germany Cartons, Boxes, Cases, Bags and Other Packing Containers, of Paper, Paperboard, Cellulose Wadding or Webs of Cellulose Fibers; Box Files, Letter Trays and Similar Articles, of Paper or Paperboard of a Kind Used in Offices, Shops or the Like Major Sourcing Countries/Regions Market Share Trend from 2010 to 2012
| Countries/Regions | 2010 | 2011 | 2012 |
| Austria↓ | 16.03% | 15.59% | 15.39% |
| Netherlands↓ | 12.20% | 11.56% | 11.54% |
| China | 10.75% | 10.68% | 10.91% |
| Switzerland | 10.21% | 9.59% | 9.65% |
| Italy | 9.75% | 9.97% | 9.42% |
| Poland | 8.04% | 8.51% | 7.86% |
| France↑ | 7.00% | 7.17% | 7.79% |
| Czech↓ | 7.80% | 7.66% | 7.10% |
| Denmark↑ | 1.30% | 1.43% | 2.76% |
| UK | 2.51% | 2.93% | 2.74% |
| Sweden | 2.69% | 2.88% | 2.42% |
| Belgium | 2.37% | 2.37% | 2.23% |
| Hungary↑ | 0.96% | 1.66% | 1.90% |
| Turkey↓ | 1.78% | 1.75% | 1.71% |
| Spain | 1.19% | 1.47% | 1.29% |
| USA | 0.77% | 0.67% | 0.87% |
| Lithuania | 0.84% | 0.75% | 0.84% |
| Finland | 0.40% | 0.40% | 0.30% |
| Ireland↑ | 0.19% | 0.21% | 0.29% |
| Hong Kong↓ | 0.52% | 0.39% | 0.27% |
Note: “↑”represents that the indicators listed continued to increase from 2010 to 2012, “↓”represents that the indicators listed continued to decrease from 2010 to 2012.
Judging from the import market share trend, the market share of France, Hungary and Ireland continued to increase while that of Austria, the Netherlands, Czech, Turkey and Hong Kong continued to decrease from 2010 to 2012.
Germany Sacks and Bags, of a Kind Used for the Packing of Goods (HS: 6305) Import Value Annual Trend from 2010 to 2012
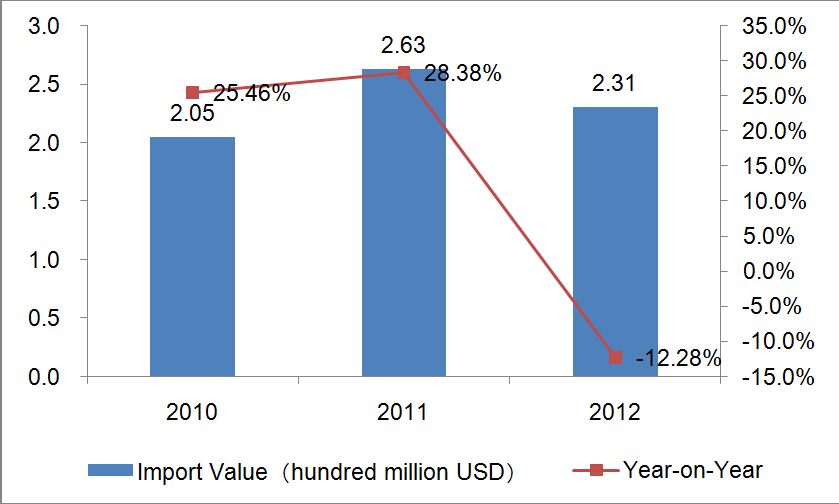
The import value of Germany sacks and bags, of a kind used for the packing of goods showed an inverted "V" trend from 2010 to 2012. The import value of the three years amounted to 205 million US dollars (with an increase of 25.46% year on year), 263 million US dollars (with an increase of 28.38% year on year) and 231 million US dollars (with a decrease of 12.28% year on year).
1.3.2. Germany Sacks and Bags, of a Kind Used for the Packing of Goods Major Sourcing Countries/Regions from 2010 to 2012
(Unit: Thousand USD)
| Countries/Regions | 2010 | 2011 | 2012 |
| Turkey | 76,960 | 94,274 | 80,565 |
| India | 29,615 | 45,314 | 37,120 |
| China | 31,419 | 36,835 | 31,034 |
| Poland | 7,736 | 12,366 | 14,440 |
| Romania | 7,377 | 14,806 | 13,889 |
| Czech | 8,491 | 11,017 | 10,194 |
| Netherlands | 9,664 | 9,936 | 8,510 |
| Bangladesh | 5,061 | 6,821 | 5,794 |
| Ukraine | 3,376 | 1,973 | 3,285 |
| Italy | 2,513 | 3,972 | 2,772 |
| UK | 2,619 | 1,919 | 2,576 |
| Greece | 466 | 2,540 | 2,498 |
| Estonia | 2,448 | 2,110 | 1,994 |
| Thailand | 2,402 | 2,746 | 1,515 |
| Vietnam | 2,634 | 1,933 | 1,446 |
| France | 1,227 | 1,133 | 1,342 |
| Serbia | 262 | 327 | 1,255 |
| Luxemburg | 325 | 847 | 1,132 |
| Indonesia | 762 | 926 | 1,037 |
| Switzerland | 664 | 676 | 1,005 |
Germany sacks and bags, of a kind used for the packing of goods major sourcing Countries are Turkey, India, China, Poland and Romania, etc. China ranked the third. Germany's import value of the product from China in 2012 amounted to 30 million dollars, with a decrease of 15.75% year on year.
Germany Sacks and Bags, of a Kind Used for the Packing of Goods Major Sourcing Countries/Regions Market Share Trend from 2010 to 2012
| Countries/Regions | 2010 | 2011 | 2012 |
| Turkey↓ | 37.53% | 35.81% | 34.89% |
| India | 14.44% | 17.21% | 16.07% |
| China↓ | 15.32% | 13.99% | 13.44% |
| Poland↑ | 3.77% | 4.70% | 6.25% |
| Romania↑ | 3.60% | 5.62% | 6.01% |
| Czech↑ | 4.14% | 4.18% | 4.41% |
| Netherlands↓ | 4.71% | 3.77% | 3.68% |
| Bangladesh | 2.47% | 2.59% | 2.51% |
| Ukraine | 1.65% | 0.75% | 1.42% |
| Italy | 1.23% | 1.51% | 1.20% |
| UK | 1.28% | 0.73% | 1.12% |
| Greece↑ | 0.23% | 0.96% | 1.08% |
| Estonia | 1.19% | 0.80% | 0.86% |
| Thailand↓ | 1.17% | 1.04% | 0.66% |
| Vietnam↓ | 1.28% | 0.73% | 0.63% |
| France | 0.60% | 0.43% | 0.58% |
| Serbia | 0.13% | 0.12% | 0.54% |
| Luxemburg↑ | 0.16% | 0.32% | 0.49% |
| Indonesia | 0.37% | 0.35% | 0.45% |
| Switzerland | 0.32% | 0.26% | 0.44% |
Note: “↑”represents that the indicators listed continued to increase from 2010 to 2012, “↓”represents that the indicators listed continued to decrease from 2010 to 2012.
Judging from the import market share trend, the market share of Poland, Romania, Czech, Greece and Luxemburg continued to increase while that of Turkey, China, the Netherlands, Thailand and Vietnam continued to decrease from 2010 to 2012.
Source: UN COMTRADE


