Exports and Main Export Countries / Regions of Chinese Engineering Machinery Industry (by value)
Exports and Main Export Countries / Regions of Chinese Crane (HS:8426) from Jan. to Sep. in 2013 (by Value)
| No. | Countries / Regions | Accumulative Total (Jan. to Sept.) | Year on Year | ||
|
|
| Volume (Set) | Value USD | Volume | Value |
| 1 | Singapore | 467 | 201,598,706 | -26.6% | 64.1% |
| 2 | Brazil | 544 | 179,939,382 | 18.3% | 92.4% |
| 3 | Korea | 314 | 158,898,833 | -51.8% | 6.4% |
| 4 | Australia | 219 | 157,684,156 | 32.7% | 106.9% |
| 5 | United Kingdom | 68 | 128,378,948 | 353.3% | 23933% |
| 6 | Indonesia | 762 | 128,226,163 | 15.3% | -3.5% |
| 7 | USA | 2,067 | 103,103,287 | 141.2% | -18.1% |
| 8 | Malaysia | 445 | 99,576,999 | -42.4% | 1.2% |
| 9 | Lebanon | 27 | 97,020,000 | 285.7% | 12139.3% |
| 10 | Sri Lanka | 97 | 93,135,094 | 90.2% | 344.7% |
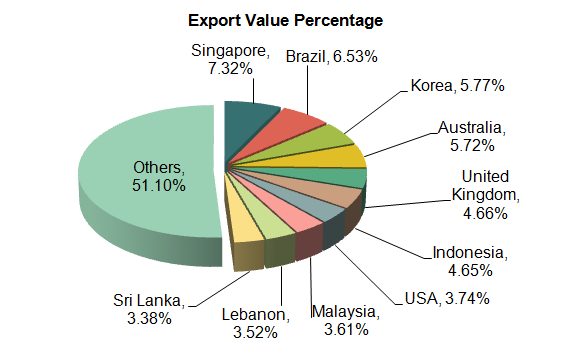
As shown in the above table, Chinese export value of cranes was about $2.755 billion from Jan. to Sept., increased by 15.3%; the growth rate of value was much faster than volume. The major export countries were Singapore, Brazil, Korea, Australia, United Kingdom, Indonesia, USA, Malaysia, Lebanon, and Sri Lanka and so on. Among these countries, the growth rate of export volume to Indonesia and USA was much faster than value, which was the total opposite of the export industry trends. Singapore was the main export market for Chinese cranes; the total export value to Singapore covered 7.32% of the total exports of cranes. Among the top ten export markets, the export value to Australia, United Kingdom, Lebanon and Sri Lanka grew rapidly, increased respectively by 106.9%, 23933%, 12139.3% and 344.7%.
Source: Customs Information Network


