Annual Export Trends of China's Centrifuges & Filtering / Purifying Machineries from 2012 to 2015
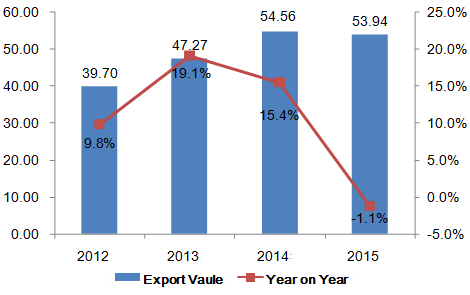
China's centrifuges & filtering / purifying machineries export has trended up during the period from 2012 to 2015. The export value in 2015 was USD 5,394,000,000, growing 35.9% on 2012.
Monthly Export Trends of China's Centrifuges & Filtering / Purifying Machineries from 2012 to 2015
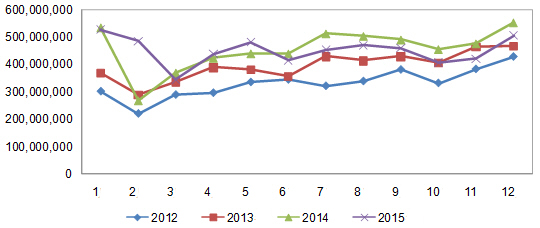
In 2015, China's centrifuges & filtering / purifying machineries exports peak was in January and trough was in March.
China's Centrifuges & Filtering / Purifying Machineries Export Volume & Value in 2015
| Month | Volume | Value(USD) | on Year | |
| Volume | Value | |||
| January | 133,313,694 | 525,435,364 | 56.30% | -1.60% |
| February | 117,217,115 | 484,142,639 | 189.50% | 81.20% |
| March | 94,263,582 | 343,781,664 | 54.50% | -6.20% |
| April | 116,101,031 | 436,881,328 | 60.90% | 3.30% |
| May | 128,545,432 | 480,703,556 | 58.10% | 9.60% |
| June | 112,260,029 | 413,204,480 | 58.90% | -5.80% |
| July | 122,369,823 | 452,944,609 | 9% | -11.50% |
| August | 125,461,155 | 468,997,714 | 1.30% | -6.70% |
| September | 129,482,628 | 459,010,427 | -4.60% | -6.20% |
| October | 130,971,632 | 405,154,422 | 6.80% | -10.90% |
| November | 113,182,806 | 419,235,860 | -21.80% | -11.80% |
| November | 120,741,288 | 504,785,359 | -15.60% | -8.60% |
| Total | 1,443,910,215 | 5,394,277,422 | 21% | -1.10% |
From January to December in 2015, China's centrifuges & filtering / purifying machineries export value reached USD 5,394,000,000, growing 14.9% on year.
Export Destinations for China's Centrifuges & Filtering / Purifying Machineries in 2015
| No. | Country/Region | Volume | Value(USD) | on Year | |
| Volume | Value | ||||
| 1 | United States | 159,666,990 | 855,534,598 | 6.2%% | 10.50% |
| 2 | Japan | 59,319,081 | 444,161,999 | 1.2%% | -22.90% |
| 3 | Indonesia | 21,158,068 | 251,225,080 | -39.70% | 9.80% |
| 4 | Malaysia | 25,497,821 | 171,768,977 | 0.90% | -8.90% |
| 5 | Vietnam | 26,814,709 | 169,671,616 | 69.30% | 22.30% |
| 6 | Hong Kong | 455,928,512 | 158,748,988 | 74.30% | -8.70% |
| 7 | Italy | 37,724,031 | 153,679,802 | 39.40% | -19.60% |
| 8 | Taiwan | 19,426,590 | 150,432,863 | -1.30% | 18.60% |
| 9 | India | 16,096,632 | 143,984,024 | -45.10% | -13.70% |
| 10 | Korea | 12,112,950 | 142,414,685 | 13.60% | 15.30% |
From January to December in 2015, the top export destinations of China's centrifuges & filtering / purifying machineries were the United States, Japan and Indonesia. In 2015, China exports to Iraq grew faster than exports to other markets and the growth was 29.7% on year.
Export Origins of China's Centrifuges & Filtering / Purifying Machineries in 2015
| No. | District | Volume | Value(USD) | on Year | |
| Volume | Value | ||||
| 1 | Guangdong | 469,777,845 | 1,126,890,341 | 32.50% | -4.10% |
| 2 | Shanghai | 127,093,842 | 868,971,329 | 9.20% | -8% |
| 3 | Zhejiang | 274,426,169 | 820,677,028 | -5.90% | 5.50% |
| 4 | Jiangsu | 366,794,915 | 786,522,825 | 53.30% | -4.20% |
| 5 | Shandong | 31,075,562 | 325,282,224 | 6.40% | 0.60% |
| 6 | Beijing | 16,334,854 | 272,972,933 | -28.10% | -13.30% |
| 7 | Fujian | 21,738,333 | 181,357,680 | -12.70% | 4.90% |
| 8 | Anhui | 41,116,776 | 159,102,849 | 15.90% | 28.40% |
| 9 | Sichuan | 11,458,510 | 155,505,741 | 13.60% | 58.70% |
| 10 | Hebei | 30,237,302 | 107,612,637 | 32.70% | 1.10% |
The top export origins of China's centrifuges & filtering / purifying machineries were Guangdong province and Shanghai city in 2015. Guangdong province exported USD 1,126,890,341, making the largest export origin in China. The average export price for centrifuges & filtering / purifying machineries from Guangxi was the highest.


