China Computer Export Volume and Value, from Jan. to Dec. 2014
| Month | Volume (PCS) | Value(USD) | Compared with the same period last year | |
| Volume | Value | |||
| Jan. | 153,495,888 | 13,417,384,938 | 8.4% | -1.6% |
| Feb. | 93,225,055 | 10,525,010,204 | -17.2% | -9.1% |
| Mar. | 133,144,980 | 12,445,944,915 | 0.3% | -9.7% |
| Apr. | 145,629,732 | 12,099,281,826 | -0.2% | -3.1% |
| May. | 146,930,904 | 12,414,853,546 | -3.9% | 7.7% |
| Jun. | 145,382,388 | 12,673,750,764 | 7.9% | 5% |
| Jul. | 165,799,406 | 14,046,925,934 | 16.6% | 10.9% |
| Aug. | 159,063,719 | 13,314,219,503 | 6% | 2.7% |
| Sep. | 151,250,391 | 13,201,877,137 | 4% | 6.6% |
| Oct. | 165,193,147 | 15,341,375,689 | 5.5% | 7.5% |
| Nov. | 176,328,181 | 17,302,628,372 | 2.8% | -0.8% |
| Dec. | 179,077,794 | 16,638,150,944 | 6.3% | -1.5% |
| Jan-Dec.Total | 1,814,521,585 | 163,421,403,772 | 3.4% | 1.1% |
The China’s export volume for Computer Industry from Jan. to Dec. 2014 amounted to 18.15 hundred million dollars, an increase of 3.4% compared to the same period of last year.The export value amounted to 1634.21 billion US dollars, an increase of 1.1% compared to the same period of last year.
China Computer Industry Export Product Statistics, from Jan. to Dec. 2014
| Product Name | Volume(PCS) | Value(USD) | Compared with the same period last year | |
| Volume | Value | |||
| Portable automatic data processing equipment,which weight≤10kg | 334,104,107 | 108,654,391,573 | 2.3% | -1.9% |
| Processing elements outside 847141 and 847149 | 57,699,905 | 17,582,665,342 | 59.3% | 27.4% |
| Storage unit | 387,049,981 | 16,635,609,626 | -1.7% | 0.3% |
| Input or output unit, whether or not containing storage unit | 779,119,197 | 6,817,911,446 | 3.1% | 11.6% |
| Automatic data processing equipment of other parts | 127,572,693 | 4,839,338,974 | -7% | 1.9% |
| Other forms of post-mortem in the system of automatic data processing equipment | 4,459,797 | 4,438,709,640 | -8.8% | -10.6% |
| Automatic data processor with central processing and input / output | 11,367,030 | 3,929,919,151 | -5.5% | -6.7% |
| Other magnetic or optical reading machine, transcription and data processing machine | 113,148,875 | 522,858,020 | 27.6% | 6.5% |
Among the China's export products from from Jan. to Dec. 2014,Portable automatic data processing equipment,which weight≤10kg has the highest proportion, which amounted to 1086.54 hundred million dollars; Processing elements outside 847141 and 847149 grows fastest, which increased 27.4% year on year.
China Computer Industry Major Export Countries/Regions Distribution, from Jan. to Dec. 2014
| No. | Countries/ Regions | Volume(PCS) | Value(USD) | Compared with the same period last year | |
| Volume | Value | ||||
| 1 | USA | 298,485,030 | 49,392,146,298 | -3% | -0.6% |
| 2 | Hong Kong | 565,255,879 | 30,032,826,101 | 10.7% | -2.6% |
| 3 | Netherlands | 108,664,953 | 15,570,611,283 | 1.6% | 3.7% |
| 4 | Japan | 63,306,365 | 9,643,185,134 | 2.2% | 2.1% |
| 5 | Germany | 46,113,773 | 8,707,088,108 | 0.4% | 11.5% |
| 6 | United Kingdom | 27,064,288 | 5,116,248,603 | 0.5% | 9.8% |
| 7 | Singapore | 83,611,133 | 3,942,637,651 | 4.8% | 6% |
| 8 | UAE | 21,405,835 | 3,365,415,413 | -5.3% | 22.4% |
| 9 | Australia | 13,713,054 | 3,328,277,272 | 5.3% | 3.7% |
| 10 | Republic of Korea | 37,432,722 | 3,063,101,776 | 9.8% | -8.7% |
| 11 | India | 89,383,886 | 2,401,414,212 | 12.3% | -10.8% |
| 12 | Canada | 9,982,086 | 2,078,063,761 | 4.1% | -0.1% |
| 13 | Mexico | 32,837,071 | 2,057,132,441 | 34.8% | 11% |
| 14 | Czech Republic | 35,371,103 | 1,821,195,585 | 7.5% | 3.2% |
| 15 | Russian Federation | 16,344,229 | 1,711,712,624 | 2.3% | -10.6% |
| 16 | Taiwan | 43,450,638 | 1,670,322,079 | 24.7% | 9.6% |
| 17 | Italy | 8,550,323 | 1,638,182,784 | -10.3% | 2.4% |
| 18 | France | 13,145,769 | 1,423,314,329 | -6.9% | -2.3% |
| 19 | Turkey | 14,263,356 | 1,054,619,176 | 12.7% | 2.7% |
| 20 | Thailand | 19,137,350 | 1,027,342,857 | 2.1% | -6.8% |
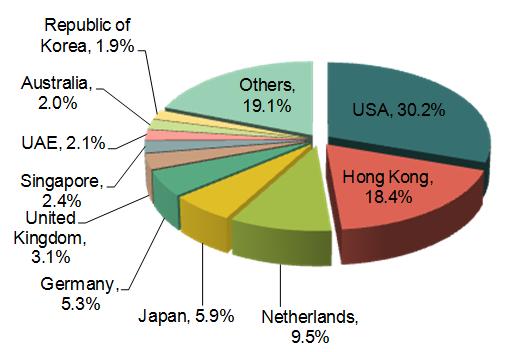
China’s Computer Industry main export markets were USA, Hong Kong, Netherlands, Japan, Germany, United Kingdom, Singapore, UAE, Australia, and Republic of Korea and so on from Jan. to Dec. 2014. Among which, the export value to the United States, Hong Kong and Netherlands accounted for 30.2%,18.4% and 9.5% of the total export value of the products.
China Computer Industry Major Original Places of Exported Goods, from Jan. to Dec. 2014
| No. | Region | Volume(PCS) | Value(USD) | Compared with the same period last year | |
| Volume | Value | ||||
| 1 | Guangdong | 1,057,334,619 | 37,909,956,861 | 3.3% | -4.8% |
| 2 | Jiangsu | 281,641,477 | 34,964,115,706 | -7.7% | -2.7% |
| 3 | Shanghai | 141,515,309 | 34,580,908,308 | -6% | -17.1% |
| 4 | Chongqing | 78,648,998 | 25,789,949,842 | 34.1% | 29.4% |
| 5 | Sichuan | 43,621,921 | 14,189,154,103 | 20.7% | 10% |
| 6 | Shandong | 39,368,387 | 5,726,040,976 | 11.6% | 32% |
| 7 | Anhui | 10,671,135 | 2,892,693,605 | 191% | 314.1% |
| 8 | Fujian | 46,282,727 | 1,892,381,067 | 22.5% | -21.7% |
| 9 | Zhejiang | 31,675,832 | 1,391,412,486 | -29.2% | 11.5% |
| 10 | Tianjin | 2,274,275 | 819,789,052 | -18.7% | 33.8% |
China’s Computer Industry main Original Places of Exported Goods were Guangdong, Jiangsu, Shanghai and Chongqing from Jan. to Dec. 2014. The export value of the four accounted for 23.4%, 21.6%, 21.4% and 15.9% of the total export value of the products.
Source: China Customs


