The United Kingdom Seats and Parts Import Value Annual Trend from 2010 to 2012
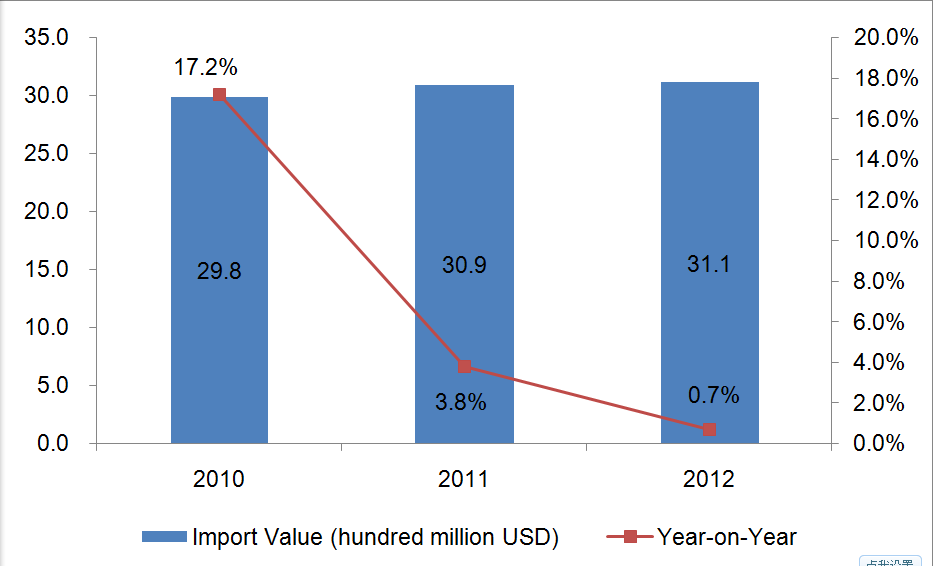
The import value of the United Kingdom seats and parts increased year by year from 2010 to 2012. The import value of the three years amounted to 2.98 billion US dollars (with an increase of 17.2% year on year), 3.09 billion US dollars (with an increase of 3.8% year on year) and 3.11 billion US dollars (with an increase of 0.7% year on year).
The United Kingdom Seats and Parts Major Sourcing Countries/Regions from 2010 to 2012
(Unit: Thousand USD)
| Countries/Regions | 2010 | 2011 | 2012 |
| China | 1,041,321 | 996,071 | 1,017,735 |
| Poland | 222,406 | 306,275 | 350,492 |
| Germany | 222,785 | 258,003 | 245,841 |
| Italy | 240,814 | 223,004 | 212,021 |
| USA | 139,721 | 162,200 | 157,483 |
| France | 129,791 | 139,593 | 135,180 |
| Czech | 111,398 | 87,638 | 116,962 |
| Romania | 52,660 | 79,948 | 85,993 |
| Japan | 76,236 | 74,499 | 78,908 |
| Thailand | 97,107 | 85,215 | 71,220 |
| Slovakia | 63,989 | 78,650 | 70,503 |
| Spain | 53,580 | 65,031 | 49,722 |
| Vietnam | 37,275 | 39,514 | 41,169 |
| Malaysia | 50,729 | 35,539 | 40,931 |
| Netherlands | 41,961 | 50,419 | 38,702 |
| Indonesia | 40,689 | 30,017 | 35,170 |
| Slovenia | 21,341 | 36,674 | 34,305 |
| Ireland | 30,229 | 35,843 | 30,409 |
| Norway | 25,393 | 24,100 | 23,521 |
| Lithuania | 21,750 | 22,670 | 22,305 |
The United Kingdom Seats and Parts Major Sourcing Countries/Regions Market Share Trend from 2010 to 2012
| Countries/Regions | 2010 | 2011 | 2012 |
| China | 34.9% | 32.2% | 32.7% |
| Poland↑ | 7.5% | 9.9% | 11.3% |
| Germany | 7.5% | 8.3% | 7.9% |
| Italy↓ | 8.1% | 7.2% | 6.8% |
| USA | 4.7% | 5.2% | 5.1% |
| France | 4.4% | 4.5% | 4.3% |
| Czech | 3.7% | 2.8% | 3.8% |
| Romania↑ | 1.8% | 2.6% | 2.8% |
| Japan | 2.6% | 2.4% | 2.5% |
| Thailand↓ | 3.3% | 2.8% | 2.3% |
| Slovakia | 2.1% | 2.5% | 2.3% |
| Spain | 1.8% | 2.1% | 1.6% |
| Vietnam | 1.3% | 1.3% | 1.3% |
| Malaysia | 1.7% | 1.1% | 1.3% |
| Netherlands | 1.4% | 1.6% | 1.2% |
| Indonesia | 1.4% | 1.0% | 1.1% |
| Slovenia | 0.7% | 1.2% | 1.1% |
| Ireland | 1.0% | 1.2% | 1.0% |
| Norway | 0.9% | 0.8% | 0.8% |
| Lithuania | 0.7% | 0.7% | 0.7% |
Note: “↑”represents that the indicators listed continued to increase from 2010 to 2012, “↓”represents that the indicators listed continued to decrease from 2010 to 2012.
Judging from the export market share trend, the market share of Poland and Romania continued to increase while that of Italy and Thailand continued to decrease from 2010 to 2012.
The United Kingdom Other Furniture and Parts Import Value Annual Trend from 2010 to 2012
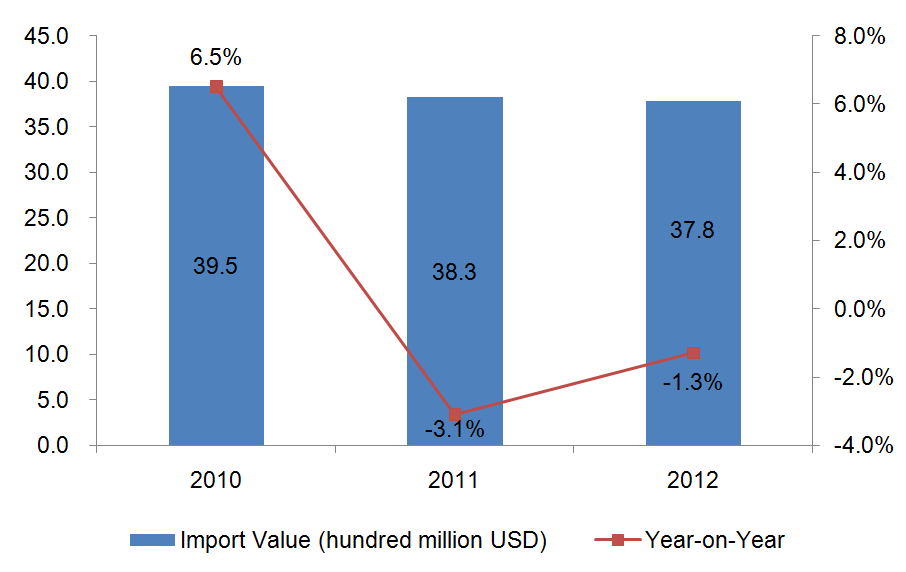
The import value of the United Kingdom other furniture and parts decreased year by year from 2010 to 2012. The import value of the three years amounted to 3.95 billion US dollars (with an increase of 6.5% year on year), 3.83 billion US dollars (with a decrease of 3.1% year on year) and 3.78 billion US dollars (with a decrease of 1.3% year on year)
The United Kingdom Other Furniture and Parts Major Sourcing Countries/Regions from 2010 to 2012
| Countries/Regions | 2010 | 2011 | 2012 |
| China | 1,300,445 | 1,247,761 | 1,375,498 |
| Italy | 490,410 | 523,048 | 483,282 |
| Germany | 380,186 | 399,181 | 365,143 |
| Vietnam | 206,315 | 188,537 | 213,340 |
| Poland | 187,900 | 198,592 | 169,683 |
| Malaysia | 159,158 | 135,894 | 130,903 |
| Sweden | 130,384 | 122,575 | 103,309 |
| Lithuania | 66,189 | 78,023 | 80,353 |
| Indonesia | 103,120 | 78,506 | 70,651 |
| Brazil | 71,014 | 63,291 | 69,713 |
| France | 70,150 | 73,439 | 62,358 |
| Austria | 55,049 | 59,410 | 62,293 |
| USA | 61,723 | 60,090 | 62,240 |
| Taiwan | 64,634 | 56,003 | 51,747 |
| Turkey | 49,038 | 43,746 | 47,317 |
| India | 40,723 | 42,919 | 42,899 |
| Spain | 39,557 | 44,855 | 39,285 |
| Denmark | 53,469 | 51,044 | 36,559 |
| Netherlands | 39,701 | 44,379 | 35,602 |
| Czech | 40,884 | 37,087 | 30,992 |
The United Kingdom Other Furniture and Parts Major Sourcing Countries/Regions Market Share Trend from 2010 to 2012
| Countries/Regions | 2010 | 2011 | 2012 |
| China | 32.90% | 32.57% | 36.38% |
| Italy | 12.41% | 13.65% | 12.78% |
| Germany | 9.62% | 10.42% | 9.66% |
| Vietnam | 5.22% | 4.92% | 5.64% |
| Poland | 4.75% | 5.18% | 4.49% |
| Malaysia↓ | 4.03% | 3.55% | 3.46% |
| Sweden↓ | 3.30% | 3.20% | 2.73% |
| Lithuania↑ | 1.67% | 2.04% | 2.13% |
| Indonesia↓ | 2.61% | 2.05% | 1.87% |
| Brazil | 1.80% | 1.65% | 1.84% |
| France | 1.77% | 1.92% | 1.65% |
| Austria↑ | 1.39% | 1.55% | 1.65% |
| USA↑ | 1.56% | 1.57% | 1.65% |
| Taiwan↓ | 1.64% | 1.46% | 1.37% |
| Turkey | 1.24% | 1.14% | 1.25% |
| India↑ | 1.03% | 1.12% | 1.13% |
| Spain | 1.00% | 1.17% | 1.04% |
| Denmark↓ | 1.35% | 1.33% | 0.97% |
| Netherlands | 1.00% | 1.16% | 0.94% |
| Czech↓ | 1.03% | 0.97% | 0.82% |
Note: “↑”represents that the indicators listed continued to increase from 2010 to 2012, “↓”represents that the indicators listed continued to decrease from 2010 to 2012.
Judging from the export market share trend, the market share of Lithuania, Austria, the United States and India continued to increase while that of Malaysia, Sweden, Indonesia, Taiwan, Denmark and the Czech Republic continued to decrease from 2010 to 2012.
The United Kingdom Mattress Supports, Articles of Bedding and Similar Furnishing Import Value Annual Trend from 2010 to 2012
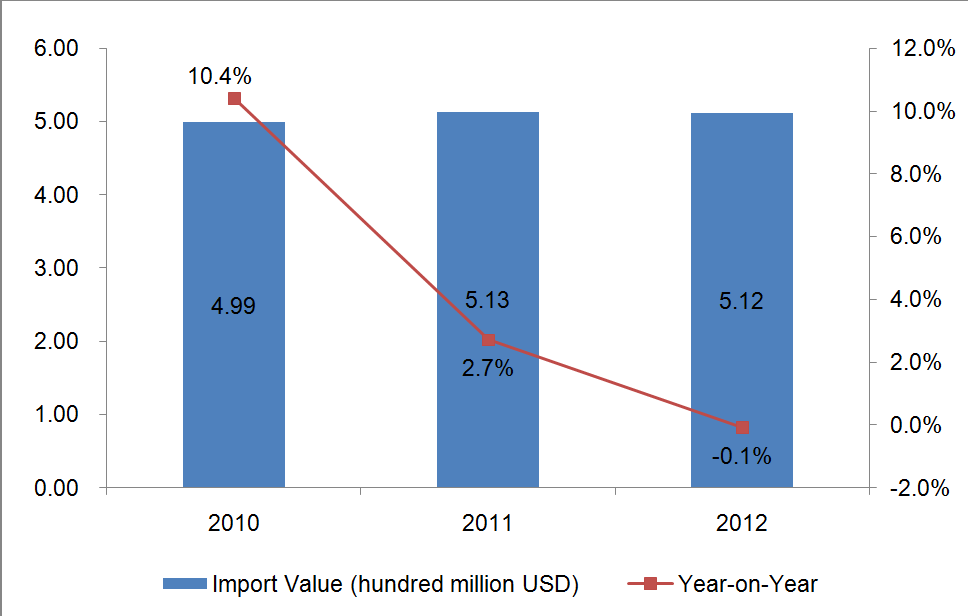
The import value of the United Kingdom mattress supports, articles of bedding and similar furnishing showed a trend of inverted "V" from 2010 to 2012. The import value of the three years amounted to 499 million US dollars (with an increase of 10.4% year on year), 513 million US dollars (with an increase of 2.7% year on year) and 512 million US dollars (with a decrease of 0.1% year on year).
The United Kingdom Mattress Supports, Articles of Bedding and Similar Furnishing Major Sourcing Countries/Regions from 2010 to 2012
(Unit: Thousand USD)
| Countries/Regions | 2010 | 2011 | 2012 |
| China | 271,657 | 266,937 | 269,990 |
| Denmark | 22,403 | 28,881 | 32,933 |
| India | 22,970 | 27,317 | 29,987 |
| Poland | 24,210 | 25,166 | 24,174 |
| Germany | 22,259 | 26,495 | 22,650 |
| Pakistan | 11,254 | 14,073 | 19,172 |
| Estonia | 13,731 | 14,791 | 18,961 |
| Ireland | 21,759 | 20,345 | 14,198 |
| Turkey | 27,203 | 15,388 | 12,036 |
| Belgium | 9,061 | 9,367 | 10,004 |
| Macedonia | 6,775 | 9,443 | 8,742 |
| Netherlands | 3,378 | 4,907 | 6,298 |
| Romania | 3,247 | 4,400 | 4,971 |
| Italy | 4,321 | 6,374 | 4,158 |
| France | 3,372 | 4,717 | 4,089 |
| Bulgaria | 2,428 | 2,933 | 3,849 |
| Hong Kong | 3,601 | 2,624 | 3,520 |
| Lithuania | 1,666 | 3,997 | 2,599 |
| USA | 3,877 | 3,066 | 2,383 |
| Hungary | 1,725 | 1,994 | 2,171 |
The United Kingdom Mattress Supports, Articles of Bedding and Similar Furnishing Major Sourcing Countries/Regions Market Share Trend from 2010 to 2012
| Countries/Regions | 2010 | 2011 | 2012 |
| China | 54.44% | 52.08% | 52.71% |
| Denmark | 4.49% | 5.63% | 6.43% |
| India↑ | 4.60% | 5.33% | 5.85% |
| Poland | 4.85% | 4.91% | 4.72% |
| Germany | 4.46% | 5.17% | 4.42% |
| Pakistan↑ | 2.26% | 2.75% | 3.74% |
| Estonia↑ | 2.75% | 2.89% | 3.70% |
| Ireland↓ | 4.36% | 3.97% | 2.77% |
| Turkey↓ | 5.45% | 3.00% | 2.35% |
| Belgium↑ | 1.82% | 1.83% | 1.95% |
| Macedonia | 1.36% | 1.84% | 1.71% |
| Netherlands↑ | 0.68% | 0.96% | 1.23% |
| Romania↑ | 0.65% | 0.86% | 0.97% |
| Italy | 0.87% | 1.24% | 0.81% |
| France | 0.68% | 0.92% | 0.80% |
| Bulgaria↑ | 0.49% | 0.57% | 0.75% |
| Hong Kong | 0.72% | 0.51% | 0.69% |
| Lithuania | 0.33% | 0.78% | 0.51% |
| USA↓ | 0.78% | 0.60% | 0.47% |
| Hungary↑ | 0.35% | 0.39% | 0.42% |
Note: “↑”represents that the indicators listed continued to increase from 2010 to 2012, “↓”represents that the indicators listed continued to decrease from 2010 to 2012.
Judging from the export market share trend, the market share of India, Pakistan, Estonia, Belgium, the Netherlands, Romania, Bulgaria and Hungary continued to increase while that of Ireland, Turkey and the United States continued to decrease from 2010 to 2012.
Source: UN COMTRADE


