2010-2012 Indonesia Plastic Machinery Import Situation
2010-2012 Indonesia Plastic Machinery Import Value Annual Trends
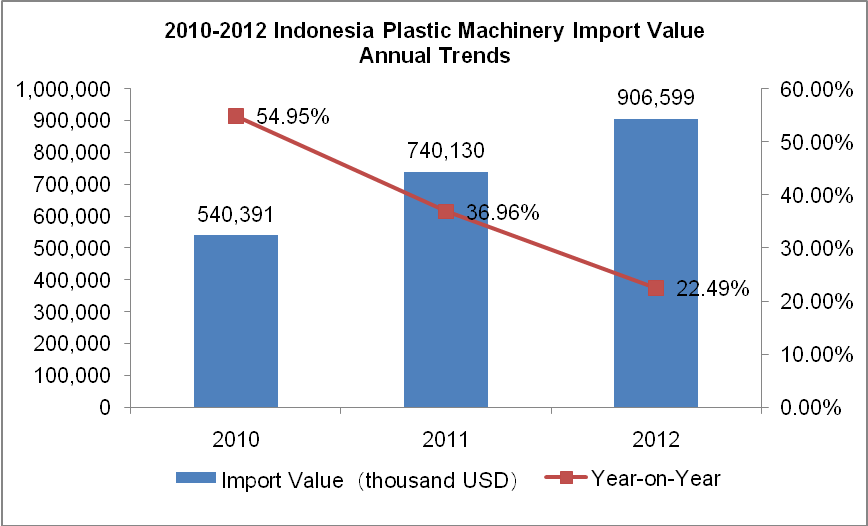
2010-2012, the imports amount of Indonesia's plastic machinery has increased steadily, but Import Value Increase declined. The Import Value was $ 540 million, $ 740 million and $ 907 million, with an increase of 54.95%, 36.96% and 22.49%.
2010-2012 Indonesia Plastic Machinery Import Market Trends Analysis
| No. | Country / Region | Import Value(USD) | 2012 Compared the Same Period 2010 | ||
|
|
| 2010 | 2011 | 2012 |
|
|
| total | 540, 391 | 740, 130 | 906, 599 | 67.77% |
| 1 | Japan | 108, 045 | 176, 500 | 211, 709 | 95.95% |
| 2 | China | 106, 792 | 164, 428 | 182, 188 | 70.60% |
| 3 | Germany | 83, 998 | 118, 784 | 122, 584 | 45.94% |
| 4 | Korea | 34, 538 | 40, 926 | 103, 807 | 200.56% |
| 5 | Taiwan | 71, 454 | 91, 588 | 93, 806 | 31.28% |
| 6 | Italy | 35, 172 | 21, 367 | 46, 942 | 33.46% |
| 7 | Netherlands | 5, 016 | 15, 984 | 19, 480 | 288.36% |
| 8 | Singapore | 11, 788 | 13, 733 | 19, 216 | 63.01% |
| 9 | Austria | 3, 368 | 11, 083 | 14, 724 | 337.17% |
| 10 | Malaysia | 17, 623 | 13, 579 | 14, 690 | -16.64% |
2010-2012, Japan is Indonesia's largest plastic machinery import sources with the import amount of 212 million U.S. dollars and an increase of 95.95% which is higher than the average lever. China is the second largest importe sources with the amount of 1.82 billion U.S. dollars.
The import increasings from Korea, Netherlands and Austria are 200.56%, 288.36% and 337.17%. Only the amount from Malaysia decreased with a decline of 16.64%
2010-2012 Indonesia Plastic Machinery Import Market Share Trends Analysis
| No. | Country / Region | Import Value Proportion | ||
|
|
| 2010 | 2011 | 2012 |
| 1 | Japan | 19.99% | 23.85% | 23.35% |
| 2 | China | 19.76% | 22.22% | 20.10% |
| 3 | Germany | 15.54% | 16.05% | 13.52% |
| 4 | Korea | 6.39% | 5.53% | 11.45% |
| 5 | Taiwan↓ | 13.22% | 12.37% | 10.35% |
| 6 | Italy | 6.51% | 2.89% | 5.18% |
| 7 | Netherlands | 0.93% | 2.16% | 2.15% |
| 8 | Singapore | 2.18% | 1.86% | 2.12% |
| 9 | Austria↑ | 0.62% | 1.50% | 1.62% |
| 10 | Malaysia↓ | 3.26% | 1.83% | 1.62% |
Indonesia's plastic machinery import market share fluctuated very much. Japan and China occupied the market share about 1/5. From 2010 to 2012, the share of Austria kept rising, and the share of aiwan and Malaysia kept decreasing.
2013 Indonesia Plastic Machinery Import Market
2013 1-7month Indonesia Plastic Machinery Import Market
| Country / Region | 2013 1-7 Month Import Amount(Thousand USD) | Compared with the Same Period | Proportion |
| total | 455, 512 | -22.88% | 100% |
| China | 106, 660 | -10.11% | 23.42% |
| Japan | 93, 193 | -36.72% | 20.46% |
| Germany | 60, 411 | -21.06% | 13.26% |
| Taiwan | 50, 953 | -16.70% | 11.19% |
| Korea | 34, 679 | -51.46% | 7.61% |
| Italy | 24, 498 | -18.89% | 5.38% |
| Swiss | 17, 130 | 331.59% | 3.76% |
| Austria | 12, 727 | 63.02% | 2.79% |
| Malaysia | 9, 326 | -12.91% | 2.05% |
| Netherlands | 7, 820 | -16.27% | 1.72% |
From January to July in 2013, Import Value of Indonesia plastic machinery is $ 456 million with a decrease of 22.88% compared the same period in 2012. China surpassed Japan to become Indonesia's main sources of plastic machinery, and it occupied 23.42% of market share. Japan’s share decreased by 36.72%. Only the Import Value from Swiss and Austria increased by 331.59% and 63.02%. Others decreased.
Source:UN Comtrade


