Note:The Following Two HS Codes are referred to as "flash memory"HS 85235110:No recorded solid-state & nonvolatile memory device (flash memory)HS 852351: Solid-state nonvolatile memory (flash memory)
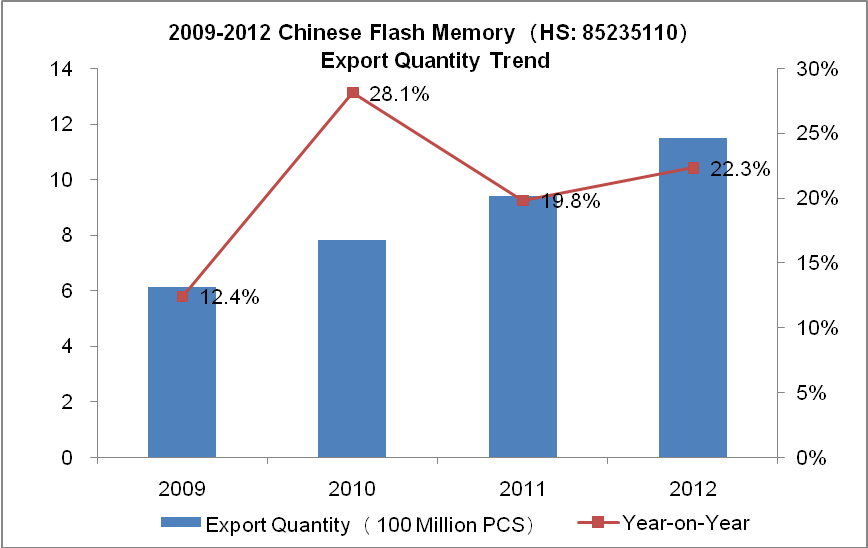
2009-2012 Chinese Flash Memory(HS: 85235110)Export Quantity Trend
2009-2012 Chinese Flash Memory(HS: 85235110)Export Quantity Trend
2009-2012 Chinese Flash Memory(HS: 85235110)Export Amount Trend
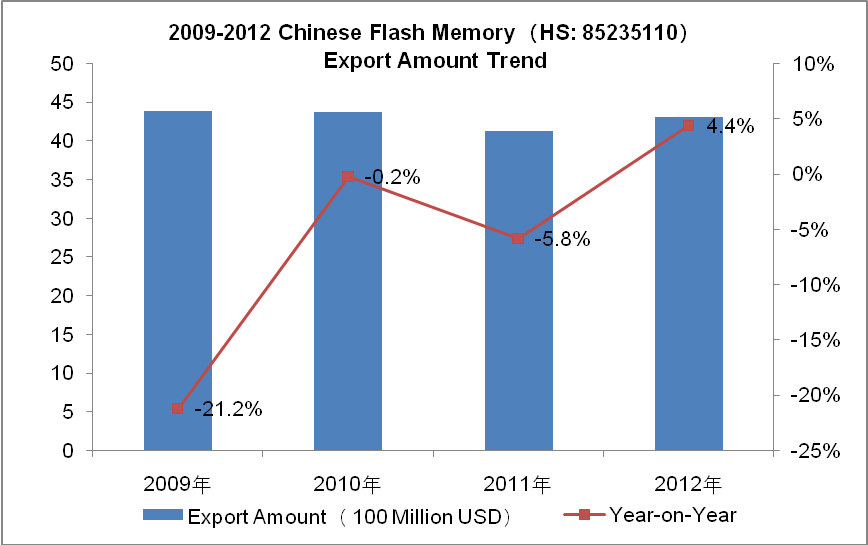
With the development of science and technology, the performance of electronic products are constantly improved, while cost reduction pushed prices lower, more electronic products are accepted by ordinary people. From 2009 to 2012, China’s flash memory export volume increased year by year, but the export amounts kept declining. In 2012 China's export volume of flash memory is about 1.147 billion, with a year-on-year growth of 22.3%; the exports amounted to $ 4.3 billion, with a year-on-year growth of 4.4%
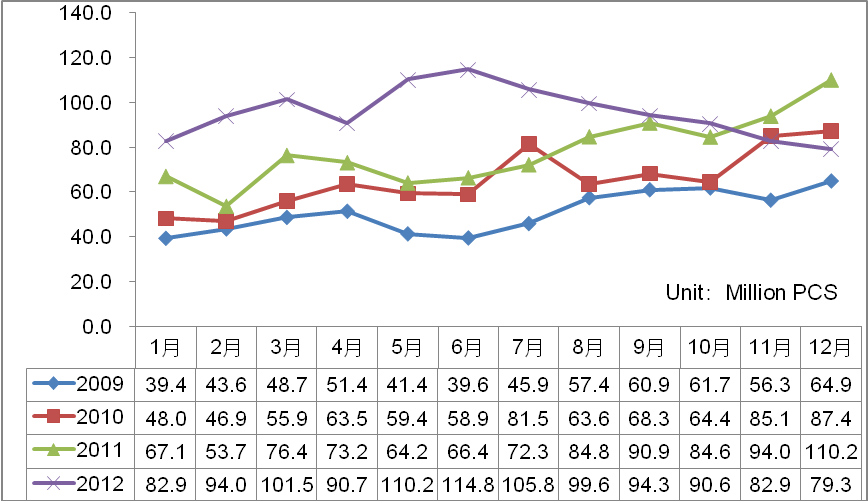
2009-2012 Chinese Flash Memory(HS: 85235110)Export Quantity Monthly Trend
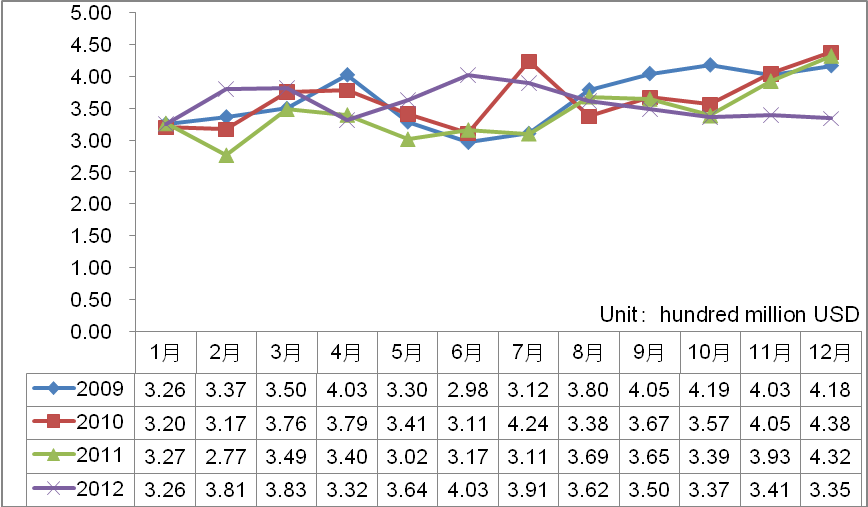
2009-2012 Chinese Flash Memory(HS: 85235110)Export Amount Monthly Trend
2009-2012 Chinese Flash Memory Major Export Countries/Regions
| No. | Export Countries &Regions | Export Amount (USD) | 2012 Growth Rate Compared with 2009 | |||
| Year 2009 | Year 2010 | Year 2011 | Year 2012 | |||
| 1 | Hong Kong | 1,590,962,388 | 1,652,962,282 | 1,550,711,444 | 1,956,691,493 | 22.99% |
| 2 | USA | 1,299,936,947 | 1,037,956,749 | 810,609,979 | 701,256,728 | -46.05% |
| 3 | Chinese Taipei | 358,289,998 | 644,586,507 | 672,209,477 | 500,407,183 | 39.67% |
| 4 | Japan | 106,298,480 | 100,936,162 | 106,325,459 | 211,960,009 | 99.40% |
| 5 | United Kingdom | 240,256,437 | 223,309,006 | 169,056,160 | 104,152,769 | -56.65% |
| 6 | Germany | 77,823,205 | 57,172,364 | 68,007,650 | 90,158,495 | 15.85% |
| 7 | India | 40,376,131 | 50,476,299 | 62,401,683 | 80,756,750 | 100.01% |
| 8 | United Arab Emirates | 27,784,956 | 39,231,173 | 42,976,435 | 58,954,249 | 112.18% |
| 9 | South Korea | 118,475,511 | 81,770,221 | 155,347,030 | 49,376,363 | -58.32% |
| 10 | Belgium | 24,781,409 | 33,032,465 | 35,518,908 | 46,931,633 | 89.38% |
| 11 | Vietnam | 2,503,737 | 1,568,505 | 18,104,904 | 38,544,129 | 1439.46% |
| 12 | Singapore | 27,246,213 | 19,327,481 | 19,573,826 | 37,395,623 | 37.25% |
| 13 | Ireland | 8,965,444 | 27,415,453 | 24,370,993 | 33,828,387 | 277.32% |
| 14 | Finland | 13,726,034 | 9,381,495 | 20,913,323 | 31,542,164 | 129.80% |
| 15 | Netherlands | 57,884,262 | 62,753,768 | 32,708,339 | 30,788,954 | -46.81% |
| 16 | France | 3,722,057 | 11,566,321 | 19,913,679 | 29,557,704 | 694.12% |
| 17 | Australia | 5,913,086 | 17,276,791 | 21,703,424 | 26,823,732 | 353.63% |
| 18 | Brazil | 11,750,983 | 19,707,333 | 53,922,395 | 24,401,310 | 107.65% |
| 19 | Italy | 6,713,732 | 11,530,785 | 15,674,407 | 17,880,887 | 166.33% |
| 20 | Canada | 18,375,330 | 8,415,875 | 16,637,551 | 17,325,272 | -5.71% |
From 2009 to 2012, the main importing countries / regions of China's flash memory are Hong Kong, USA, Chinese Taipei, Japan, United Kingdom, Germany, India, United Arab Emirates, South Korea, Belgium and etc., Vietnam is the fastest growing country in importing Chinese flash memory which with a total amount of $ 2.504 million in 2009 and approximately $ 38.544 million in 2012, with a growth of 1439.46% compared to 2009.
2009-2012 Market Share Trends of Chinese Flash Memory of Major Export Countries/Regions
| No. | Export Countries &Regions
| Export Amount (Proportion of %) | |||
| Year 2009 | Year 2010 | Year 2011 | Year 2012 | ||
| 1 | Hong Kong | 36.32% | 37.80% | 37.63% | 45.46% |
| 2 | USA↓ | 29.68% | 23.74% | 19.67% | 16.29% |
| 3 | Chinese Taipei | 8.18% | 14.74% | 16.31% | 11.63% |
| 4 | Japan | 2.43% | 2.31% | 2.58% | 4.92% |
| 5 | United Kingdom↓ | 5.48% | 5.11% | 4.10% | 2.42% |
| 6 | Germany | 1.78% | 1.31% | 1.65% | 2.09% |
| 7 | India↑ | 0.92% | 1.15% | 1.51% | 1.88% |
| 8 | United Arab Emirates↑ | 0.63% | 0.90% | 1.04% | 1.37% |
| 9 | South Korea | 2.70% | 1.87% | 3.77% | 1.15% |
| 10 | Belgium↑ | 0.57% | 0.76% | 0.86% | 1.09% |
| 11 | Vietnam | 0.06% | 0.04% | 0.44% | 0.90% |
| 12 | Singapore | 0.62% | 0.44% | 0.47% | 0.87% |
| 13 | Ireland | 0.20% | 0.63% | 0.59% | 0.79% |
| 14 | Finland | 0.31% | 0.21% | 0.51% | 0.73% |
| 15 | Netherlands | 1.32% | 1.44% | 0.79% | 0.72% |
| 16 | France↑ | 0.08% | 0.26% | 0.48% | 0.69% |
| 17 | Australia↑ | 0.13% | 0.40% | 0.53% | 0.62% |
| 18 | Brazil | 0.27% | 0.45% | 1.31% | 0.57% |
| 19 | Italy↑ | 0.15% | 0.26% | 0.38% | 0.42% |
| 20 | Canada | 0.42% | 0.19% | 0.40% | 0.40% |
Note: ↑mean that from 2009 to 2011, the total export amount to certain countries kept rising in the proportion of China's total export amount. ↓ mean that from 2009 to 2011, the export amount to certain countries continued declining in the proportion of China's total export amount.
According to the share trends of exporting market from 2009 to 2012, India, the United Arab Emirates, Belgium, France, Australia and Italy are the continued growth countries; the United States and the United Kingdom continued declining.


