2010-2012 Thailand Plastic Machinery Import Situation
2010-2012 Thailand Plastic Machinery Import Value Annual Trends
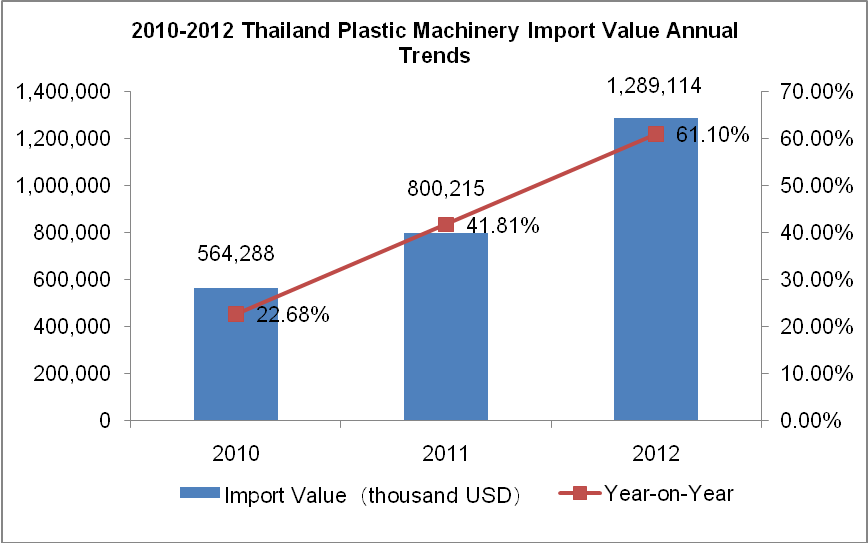
2010-2012, Thailand plastic machinery products Import Value and increasing speed were both increasing. Imports amount were $ 564 million, $ 800 million and $ 1.289 billion in 2010, 2011 and 2012 with increasings of 22.68%, 41.81% and 61.1%. The imports amount in 2012 was increased rapidly by 128.45% over 2010.
2010-2012 Thailand Plastic Machinery Import Market Trends Analysis
| No. | Country / Region | Import Value(Thousand USD) | 2012 Compared the Same Period 2010 | ||
|
|
| 2010 | 2011 | 2012 |
|
|
| total | 564, 288 | 800, 215 | 1, 289, 114 | 128.45% |
| 1 | Japan | 217, 873 | 327, 074 | 647, 031 | 196.98% |
| 2 | China | 102, 187 | 162, 529 | 251, 659 | 146.27% |
| 3 | Taiwan | 88, 225 | 93, 020 | 133, 338 | 51.13% |
| 4 | Germany | 57, 840 | 84, 366 | 99, 040 | 71.23% |
| 5 | Korea | 13, 122 | 25, 100 | 32, 986 | 151.38% |
| 6 | United States | 12, 625 | 19, 747 | 21, 926 | 73.67% |
| 7 | Italy | 15, 228 | 16, 975 | 19, 543 | 28.34% |
| 8 | Malaysia | 7, 343 | 7, 837 | 17, 656 | 140.45% |
| 9 | Austria | 4, 318 | 7, 733 | 13, 029 | 201.74% |
| 10 | Singapore | 4, 322 | 5, 828 | 11, 994 | 177.51% |
Thailand is the world's third-largest plastic machinery import market and China's most important export market. The rubber plantation industry is an important pillar industry of Thailand. Thailand has large and stable demand for plastic and rubber processing machinery .
2010-2012, Japan is Thailand's largest sources of imports source, and China and Taiwan were ranked second and third.
Since Thailand plastic machinery Import Value grew rapidly. In 2012, the increasings of imports amount from Japan, China, Korea, Malaysia, Austria and Singapore were all more than 100%,. The increasing of Austria rose to 201.74%
2010-2012 Thailand Plastic Machinery Import Market Share Trends Analysis
| No. | Country / Region | Import Value Proportion | ||
|
|
| 2010 | 2011 | 2012 |
| 1 | Japan↑ | 38.61% | 40.87% | 50.19% |
| 2 | China | 18.11% | 20.31% | 19.52% |
| 3 | Taiwan↓ | 15.63% | 11.62% | 10.34% |
| 4 | Germany | 10.25% | 10.54% | 7.68% |
| 5 | Korea | 2.33% | 3.14% | 2.56% |
| 6 | United States | 2.24% | 2.47% | 1.70% |
| 7 | Italy↓ | 2.70% | 2.12% | 1.52% |
| 8 | Malaysia | 1.30% | 0.98% | 1.37% |
| 9 | Austria↑ | 0.77% | 0.97% | 1.01% |
| 10 | Singapore | 0.77% | 0.73% | 0.93% |
In 2012, more than 1/2 of Thailand imported plastic machineries were imported from Japan, plastic, nearly 1/5 of the machineries were imported from China. The source from Japan, China and Taiwan accounted for 80% of total imports. From 2010 to 2012, rising sources were Japan and Austria, and dropping sources were Taiwan and Italy
2013 Thailand Plastic Machinery Import Situation
2013 1-9 Month Thailand plastic Machinery Importmarket
| Country / Region | 2013 Jan. - Sep. Imports Amount(Thousand Usd) | Compared With The Same Period | Proportion |
| total | 646, 362 | -35.00% | 100% |
| Japan | 214, 516 | -58.91% | 33.19% |
| China | 152, 312 | -17.47% | 23.56% |
| Germany | 83, 644 | 20.26% | 12.94% |
| Taiwan | 80, 035 | -17.95% | 12.38% |
| Korea | 26, 078 | 18.43% | 4.03% |
| United States | 19, 985 | 19.82% | 3.09% |
| Italy | 18, 225 | 5.07% | 2.82% |
| Netherlands | 3, 121 | 54.66% | 0.48% |
| France | 5, 131 | 17.23% | 0.79% |
| India | 5, 046 | 98.04% | 0.78% |
From January to September in 2013, Import Value of Thailand plastic machinery was $ 646 million; drop by 35% compared to the same period in 2012. Japan remained Thailand's main sources, but also with a decreased by 58.91%, higher than the everage decline. Japan's market share decreased from more than 1/2 down to less than 1/3. This market share lost mainly went to China, Germany, Taiwan and Korea. From January to September in 2013, in the top ten import markets, the amount of plastic machinery imports from India grew by 98.04%. It was the fastest-growing sources. The imports from Japan, China and Taiwan decreased.


