2011-2013 Global Computer Import Trend Analysis
2011-2013 Global Computer Import Value Annual Trend
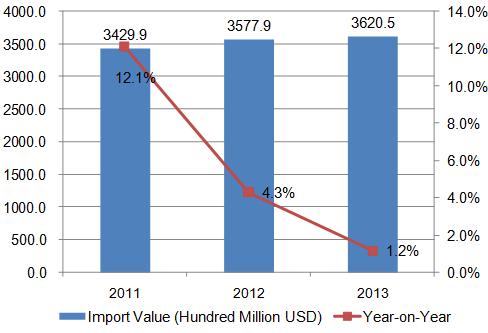
Global Computer Industry import value increased YOY from 2011 to 2013, the growth rate declined YOY. The import value for these three years amounted to 3429.9 billion US dollars, 3577.9 billion US dollars and 3620.5 billion US dollars. While the import value increased by 12.1%, 4.3% and 1.2% year on year.
2011-2013 Global Computer Import Product Analysis
| Product | Import Value(Thousand USD) | Growth in 2013 compared with 2011 | ||
| 2011 | 2012 | 2013 | ||
| Computer | 342,987,251 | 357,785,819 | 362,049,873 | 5.6% |
| Portable automatic data processing equipment,which weight≤10kg | 146,406,673 | 151,749,609 | 161,268,118 | 10.2% |
| Storage unit | 84,009,584 | 94,197,336 | 82,813,476 | -1.4% |
| Processing elements outside 847141 and 847149 | 46,370,083 | 44,910,624 | 49,496,167 | 6.7% |
| Input or output unit, whether or not containing storage unit | 13,700,394 | 15,368,865 | 17,131,615 | 25.0% |
| Automatic data processing equipment of other parts | 16,556,589 | 16,482,389 | 16,855,519 | 1.8% |
| Other forms of post-mortem in the system of automatic data processing equipment | 17,617,126 | 16,275,171 | 16,386,802 | -7.0% |
| Automatic data processor with central processing and input / output | 10,885,654 | 10,863,925 | 10,508,045 | -3.5% |
| Other magnetic or optical reading machine, transcription and data processing machine | 7,419,173 | 7,923,041 | 7,572,077 | 2.1% |
| Analog or mixed automatic data processing machine | 21,716 | 14,793 | 17,717 | -18.4% |
Among the Global import products, Portable automatic data processing equipment,which weight≤10kg has the highest proportion, followed by storage unit; Input or output unit, whether or not containing storage unit grows fastest, which increased 25% year on year.
2011-2013 Global Computer Industry Import Market Trend Analysis
| No. | Countries/ Regions | Import Value(Thousand USD) | Growth in 2013 compared with 2011 | ||
| 2011 | 2012 | 2013 | |||
| Total | 342,987,251 | 357,785,819 | 362,049,873 | 5.6% | |
| 1 | USA | 81,194,054 | 85,716,185 | 83,120,872 | 2.4% |
| 2 | Hong Kong | 17,735,565 | 22,526,909 | 37,150,383 | 109.5% |
| 3 | China | 29,350,999 | 34,885,635 | 29,068,207 | -1.0% |
| 4 | Germany | 20,650,180 | 18,705,627 | 18,028,772 | -12.7% |
| 5 | Netherlands | 17,025,122 | 17,531,575 | 17,645,426 | 3.6% |
| 6 | Japan | 17,039,687 | 16,997,102 | 16,473,881 | -3.3% |
| 7 | United Kingdom | 15,788,742 | 14,308,774 | 14,406,816 | -8.8% |
| 8 | France | 10,678,930 | 9,954,049 | 10,197,216 | -4.5% |
| 9 | Canada | 9,443,724 | 9,213,346 | 8,986,334 | -4.8% |
| 10 | Mexico | 7,638,061 | 8,338,778 | 8,832,648 | 15.6% |
| 11 | Australia | 6,794,453 | 6,968,412 | 6,657,890 | -2.0% |
| 12 | Singapore | 6,465,038 | 6,978,055 | 6,558,867 | 1.5% |
| 13 | Czech Republic | 7,269,557 | 6,482,470 | 5,591,335 | -23.1% |
| 14 | UAE | 4,947,047 | 5,748,153 | 5,219,235 | 5.5% |
| 15 | Italy | 6,086,076 | 5,874,333 | 5,179,244 | -14.9% |
| 16 | Russian Federation | 5,260,374 | 5,827,836 | 4,864,633 | -7.5% |
| 17 | Republic of Korea | 4,755,356 | 4,697,535 | 4,734,101 | -0.4% |
| 18 | India | 3,478,102 | 4,276,363 | 4,600,931 | 32.3% |
| 19 | Sweden | 3,755,298 | 3,813,683 | 4,126,433 | 9.9% |
| 20 | Thailand | 3,252,370 | 4,369,885 | 3,888,098 | 19.5% |
Note: Yellow font is mirror data
From 2011-2013, USA was the global largest computer import country, the imports are approximately 831.21 hundred million dollars, which increased 2.4% year on year. Hong Kong and China were ranked second and third, Hong Kong's imports increased by 109.5% year on year, which is the highest growth rate of the twenty imports.
2011-2013 Global Computer Industry Export Market Share Trend Analysis
| No. | Countries/ Regions | Import Value Share | ||
| 2011 | 2012 | 2013 | ||
| 1 | USA | 23.7% | 24.0% | 23.0% |
| 2 | Hong Kong↑ | 5.2% | 6.3% | 10.3% |
| 3 | China | 8.6% | 9.8% | 8.0% |
| 4 | Germany↓ | 6.0% | 5.2% | 5.0% |
| 5 | Netherlands↓ | 5.0% | 4.9% | 4.9% |
| 6 | Japan↓ | 5.0% | 4.8% | 4.6% |
| 7 | United Kingdom↓ | 4.6% | 4.0% | 4.0% |
| 8 | France | 3.1% | 2.8% | 2.8% |
| 9 | Canada↓ | 2.8% | 2.6% | 2.5% |
| 10 | Mexico↑ | 2.2% | 2.3% | 2.4% |
| 11 | Australia↓ | 2.0% | 1.9% | 1.8% |
| 12 | Singapore | 1.9% | 2.0% | 1.8% |
| 13 | Czech Republic↓ | 2.1% | 1.8% | 1.5% |
| 14 | UAE | 1.4% | 1.6% | 1.4% |
| 15 | Italy↓ | 1.8% | 1.6% | 1.4% |
| 16 | Russian Federation | 1.5% | 1.6% | 1.3% |
| 17 | Republic of Korea↓ | 1.4% | 1.3% | 1.3% |
| 18 | India↑ | 1.0% | 1.2% | 1.3% |
| 19 | Sweden | 1.1% | 1.1% | 1.1% |
| 20 | Thailand | 0.9% | 1.2% | 1.1% |
Note: "↑"represents that the indicators listed, continued to increase from 2011 to 2013, "↓"represents that the indicators listed, continued to decrease from 2011 to 2013.
Among the above twenty import markets, from 2011-2-13, the market share for Hong Kong, Mexico and India continued to rise, while that of the Germany, Netherlands, Japan, United Kingdom, Canada, Australia, Czech Republic, Italy and Republic of Korea continued to decline.
2011-2013 Global Computer Industry Export Trend Analysis
2011-2013 Global Computer Industry Export Market Trend Analysis
| No. | Countries/ Regions | Export Value(thousand USD) | Growth in 2013 compared with 2011 | ||
| 2011 | 2012 | 2013 | |||
| Total | 327,221,509 | 345,170,637 | 324,788,123 | -0.7% | |
| 1 | China | 152,028,995 | 163,436,840 | 161,714,037 | 6.4% |
| 2 | USA | 27,375,157 | 27,784,839 | 26,516,808 | -3.1% |
| 3 | Mexico | 16,501,639 | 18,438,728 | 17,401,275 | 5.5% |
| 4 | Netherlands | 16,440,205 | 15,543,613 | 15,591,549 | -5.2% |
| 5 | Thailand | 11,189,577 | 13,711,602 | 12,182,046 | 8.9% |
| 6 | Germany | 12,343,041 | 11,281,062 | 10,981,014 | -11.0% |
| 7 | Singapore | 8,450,856 | 9,411,675 | 9,723,511 | 15.1% |
| 8 | Czech Republic | 10,270,467 | 10,283,775 | 9,187,373 | -10.5% |
| 9 | Malaysia | 9,691,213 | 9,733,690 | 8,891,681 | -8.3% |
| 10 | Viet Nam | 599,712 | 1,491,449 | 5,945,849 | 891.5% |
| 11 | United Kingdom | 3,968,754 | 3,878,641 | 4,088,847 | 3.0% |
| 12 | Republic of Korea | 3,312,017 | 4,053,040 | 4,064,591 | 22.7% |
| 13 | Philippines | 2,984,752 | 3,944,713 | 3,532,217 | 18.3% |
| 14 | Taiwan | 4,401,505 | 3,758,975 | 3,424,821 | -22.2% |
| 15 | Ireland | 2,965,447 | 2,816,665 | 3,396,828 | 14.5% |
| 16 | Hungary | 2,987,767 | 2,928,788 | 3,014,660 | 0.9% |
| 17 | Poland | 2,999,726 | 2,963,540 | 2,787,784 | -7.1% |
| 18 | France | 3,239,183 | 2,524,113 | 2,513,013 | -22.4% |
| 19 | Japan | 2,544,299 | 2,412,114 | 2,149,919 | -15.5% |
| 20 | Italy | 2,113,484 | 2,229,594 | 2,101,153 | -0.6% |
Note: Yellow font is mirror data
The global exports from 2011-2013 amounted to 3272.22 billion US dollars, 3451.71 billion US dollars and 3247.88billion US dollars, the export value of 2013 are basically flat with the 2011.
2013 China Computer export value was 1617.14 billion US dollars, which the world's largest exporter of computer, increased 6.4% than 2011, accounted for 49.8% of the global export market share, followed by USA and Mexico. Among the above twenty export markets, Viet Nam's exports increased 891.5% than 2011, which is the highest growth rate of the twenty imports.
2011-2013 Global Computer Industry Export Market Share Trend Analysis
| No. | Countries/ Regions | Export Value Share | ||
| 2011 | 2012 | 2013 | ||
| 1 | China↑ | 46.5% | 47.3% | 49.8% |
| 2 | USA | 8.4% | 8.0% | 8.2% |
| 3 | Mexico↑ | 5.0% | 5.3% | 5.4% |
| 4 | Netherlands | 5.0% | 4.5% | 4.8% |
| 5 | Thailand | 3.4% | 4.0% | 3.8% |
| 6 | Germany | 3.8% | 3.3% | 3.4% |
| 7 | Singapore↑ | 2.6% | 2.7% | 3.0% |
| 8 | Czech Republic↓ | 3.1% | 3.0% | 2.8% |
| 9 | Malaysia↓ | 3.0% | 2.8% | 2.7% |
| 10 | Viet Nam↑ | 0.2% | 0.4% | 1.8% |
| 11 | United Kingdom | 1.2% | 1.1% | 1.3% |
| 12 | Republic of Korea↑ | 1.0% | 1.2% | 1.3% |
| 13 | Philippines | 0.9% | 1.1% | 1.1% |
| 14 | Taiwan↓ | 1.3% | 1.1% | 1.1% |
| 15 | Ireland | 0.9% | 0.8% | 1.0% |
| 16 | Hungary | 0.9% | 0.8% | 0.9% |
| 17 | Poland↓ | 0.9% | 0.9% | 0.9% |
| 18 | France | 1.0% | 0.7% | 0.8% |
| 19 | Japan↓ | 0.8% | 0.7% | 0.7% |
| 20 | Italy | 0.6% | 0.6% | 0.6% |
Note: "↑"represents that the indicators listed, continued to increase from 2011 to 2013, "↓"represents that the indicators listed, continued to decrease from 2011 to 2013.
Among the global twenty export markets from 2011-2013, the market share of China, Mexico, Singapore, Viet Nam and Republic of Korea are increased year by year, Czech Republic, Malaysia, Taiwan, Poland and Japan are delcined year by year.
Source: UN Comtrade


