China Audio & Sets Export Volume and Value, from Jan. to Dec. 2014
| Month | Volume ( (-) | Value (USD) | Compared to the Same Time of Last Year | |
| Volume | Value | |||
| Jan. | 528,066,890 | 1,200,828,484 | 5.5% | 11.3% |
| Feb. | 281,120,710 | 646,299,850 | -19.3% | -16.2% |
| Mar. | 490,743,206 | 1,017,358,369 | 5% | 12.7% |
| Apr. | 530,485,604 | 1,158,134,755 | -2.5% | 5.7% |
| May | 512,729,509 | 1,194,701,299 | -11.8% | 5.8% |
| Jun. | 495,677,444 | 1,098,880,602 | -8.5% | 10.3% |
| Jul. | 557,789,149 | 1,346,001,892 | -2.1% | 23% |
| Aug. | 576,926,170 | 1,453,211,474 | 0 | 24.7% |
| Sep. | 593,837,802 | 1,467,419,250 | 1.4% | 15.9% |
| Oct. | 604,493,022 | 1,465,179,351 | 8.1% | 8.4% |
| Nov. | 559,364,428 | 1,515,129,683 | -1.7% | 12.8% |
| Dec. | 592,805,394 | 1,374,947,150 | 11.8% | 10.7% |
| Total | 6,324,039,328 | 14,938,092,159 | -0.8% | 11.2% |
China Audio & Sets export value has reached 14.94 billion USD, from Jan. to Dec. 2014, increasing by 11.2% compared to the same period of last year.
China Audio & Sets Major Export Countries/Areas Distribution, from Jan. to Dec. 2014
| No. | Country/Regions | Volume (-) | Value (USD) | Compared to the Same Time of Last Year | |
| Volume | Value | ||||
| 1 | United States | 554,289,425 | 3,519,491,624 | 12.8% | 14.4% |
| 2 | Hong Kong | 1,920,384,139 | 2,908,595,537 | 1.1% | 9.7% |
| 3 | Malaysia | 950,392,038 | 585,102,248 | -12.4% | -11.1% |
| 4 | Holland | 66,237,069 | 539,039,103 | 3.3% | 25.6% |
| 5 | Republic of Korea | 320,995,111 | 521,285,393 | -12.4% | 9.3% |
| 6 | Germany | 132,606,384 | 495,125,488 | 6.9% | 14.1% |
| 7 | Japan | 136,172,987 | 457,779,587 | -10.6% | -3.4% |
| 8 | Vietnam | 527,789,753 | 435,903,674 | 6% | 2.7% |
| 9 | India | 293,967,084 | 422,599,851 | -10% | 10.3% |
| 10 | Mexico | 90,959,864 | 404,058,301 | 15.2% | 31.6% |
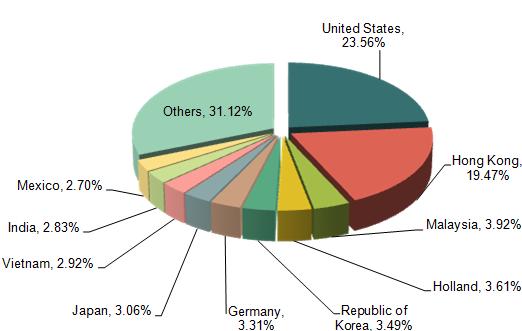
The export data from Jan. to Dec. 2014 shows that China Audio & Sets major export markets are the United States, Hong Kong, Malaysia, Holland, Republic of Korea, Germany, Japan, Vietnam, India and Mexico.
The United States is the biggest export market of China Audio & Sets. From Jan. to Dec. 2014, the accumulative export value we have got in Japan market is about 3.52 billion USD, increasing 14.4% compared to the same time of last year, which accounted for 23.56% of the total export value of this particular product. Hong Kong ranked the second, with its market share of about 19.47%.
China Audio & Sets Top Regions of Origin, from Jan. to Dec. 2014
| No. | Regions | Volume (-) | Value (USD) | Compared to the Same Time of Last Year | |
| Volume | Value | ||||
| 1 | Guangdong | 2,852,397,153 | 10,531,136,976 | 5.4% | 17% |
| 2 | Jiangsu | 1,271,290,427 | 1,287,851,398 | -4.5% | 9.9% |
| 3 | Zhejiang | 461,262,293 | 913,367,664 | -12.1% | 7.2% |
| 4 | Shandong | 947,714,361 | 665,168,863 | -10.8% | -6.4% |
| 5 | Shanghai | 85,964,974 | 393,762,107 | 42.1% | -7.1% |
| 6 | Guangxi | 75,871,310 | 252,464,356 | 3.5% | -21.2% |
| 7 | Tianjin | 220,395,427 | 216,911,856 | -7.2% | -10.4% |
| 8 | Jiangxi | 206,141,349 | 143,108,826 | 9.6% | 6.1% |
| 9 | Fujian | 41,311,504 | 135,515,089 | 7.2% | -3.8% |
| 10 | Liaoning | 6,285,573 | 85,738,296 | 13.6% | 19.9% |
Guangdong, Jiangsu and Zhejiang are the top regions of origin of Chinese Audio & Sets. From Jan. to Dec. 2014, the total export volume of Audio & Sets of the above-mentioned three provinces accounted for 70.50% of the total export volume of this particular product, with its export value accounting for 85.23%.


