2012 China Non-ferrous minerals and materials industry Export Value & Volume, and Major Export Countries
The export value & volume and major export countries/regions for 2012 China Manganese ores and concentrates (including ferruginous manganese ores and concentrates with a manganese content of 20% or more) - (Ranked by export value)
| No. | Country/Region | Total from Jan. to Dec. | Compared with the same period of last year | ||
|
|
| Volume(Kg) | Value(USD) | Volume | Value |
| 1 | India | 81,219,321 | 14,240,157 | 0.2 | -25.8 |
| 2 | Vietnam | 38,154,266 | 8,467,936 | 139.6 | 73.2 |
| 3 | Italy | 2,378,000 | 463,300 | 455.6 | 414.6 |
| 4 | Russia | 1,348,123 | 308,677 | 0 | 0 |
| 5 | Thailand | 1,069,000 | 207,178 | 969 | 447.6 |
| 6 | Japan | 160,000 | 81,830 | -43 | -49.1 |
| 7 | North Korea | 364,889 | 77,876 | 508.1 | 389.8 |
| 8 | South Korea | 260,000 | 33,700 | 18.2 | 53.2 |
| 9 | Philippines | 45,500 | 27,887 | 0 | 0 |
| 10 | Kazakhstan | 40,000 | 9,600 | 0 | 0 |
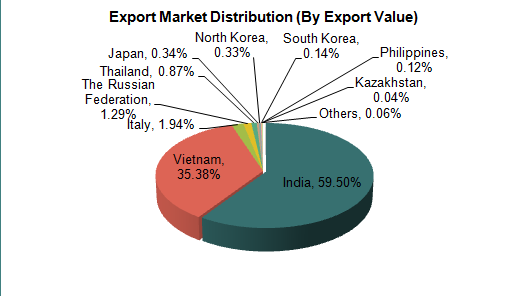
The export value for 2012 China Manganese ores and concentrates (including ferruginous manganese ores and concentrates with a manganese content of 20% or more) reached 23932 thousands USD, dropped 15.5% as before. The major export countries/regions include India, Vietnam, Italy, Russia, Thailand, Japan, North & South Korea, Philippines and Kazakhstan. Among them, India and Vietnam are two biggest consumption markets of these minerals. The export value to India held 59.5% of whole market, and 35.38% for Vietnam market. The export value rose rapidly to Italy, Thailand and North Korea with 414.6%、447.6% and 389.8%growth separately.
2.2.The export value & volume and major export countries/regions for 2012 China Copper ores and concentrates - (Ranked by export value)
| No. | Country/Region | Total from Jan. to Dec. | Compared with the same period of last year | ||
|
|
| Volume(Kg) | Value(USD) | Volume | Value |
| 1 | Romania | 456,835 | 573,982 | 0 | 0 |
| 2 | Italy | 44,000 | 43,040 | 120 | 49.8 |
| 3 | Taiwan | 20,140 | 37,635 | 0 | 0 |
| 4 | Korea | 2,800 | 1,680 | 0 | 0 |
| 5 | Germany | 102 | 430 | 0 | 0 |
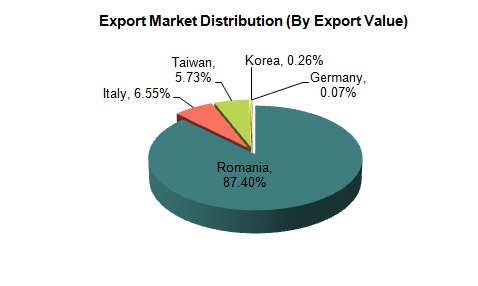
The data by 2012 exports shows that 2012 China Copper ores and concentrates export value reached 657 thousands USD, took a 1035.8% growth rate as before. The major exports countries include Romania, Italy, Taiwan, Korea and Germany. As the biggest exports market, the export value to Romania held 87.4% of whole market.
The export value & volume and major export countries/regions for 2012 China Molybdenum ores and concentrates - (Ranked by export value)
| No. | Country/Region | Total from Jan. to Dec. | Compared with the same period of last year | ||
|
|
| Volume(Kg) | Value(USD) | Volume | Value |
| 1 | South Korea | 6,670,855 | 120,006,976 | -12.8 | -25.9 |
| 2 | Netherland | 1,446,186 | 24,479,257 | -61.2 | -69.1 |
| 3 | Japan | 1,224,000 | 21,525,384 | -50.6 | -59.6 |
| 4 | India | 886,000 | 15,999,725 | -14.9 | -26.5 |
| 5 | Taiwan | 698,129 | 12,249,215 | 0 | 16.5 |
| 6 | Russia | 160,000 | 3,202,082 | -73 | -75.2 |
| 7 | Australia | 160,000 | 2,847,191 | 33.3 | 13.9 |
| 8 | Chile | 108,318 | 1,280,713 | -37.2 | -42.2 |
| 9 | Italy | 40,000 | 848,349 | 0 | 0 |
| 10 | Unite States | 40,000 | 804,321 | -88.2 | -89.4 |
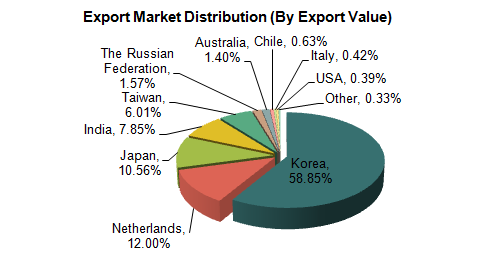
The data by 2012 exports shows that 2012 China Molybdenum ores and concentrates export value reached 203925 thousands USD, took a 45.7% growth rate only as before. The major exports countries include South Korea, Netherland, Japan, India, Taiwan, Russia, Australia, Chile, Italy and Unite States. As the biggest exports market, the export value to South Korea held 58.85% of whole market.
The export value & volume and major export countries/regions for 2012 China Titanium ores and concentrates - (Ranked by export value)
| No. | Country/Region | Total from Jan. to Dec. | Compared with the same period of last year | ||
|
|
| Volume(Kg) | Value(USD) | Volume | Value |
| 1 | Thailand | 5,310,000 | 14,082,221 | 10.3 | 160.1 |
| 2 | Indonesia | 1,691,200 | 4,512,459 | 42.1 | 188.3 |
| 3 | Korea | 1,320,122 | 3,484,800 | 757.2 | 1206 |
| 4 | India | 1,394,257 | 3,392,746 | 665.9 | 1965.4 |
| 5 | Japan | 770,000 | 2,074,572 | -55.9 | -3.2 |
| 6 | Ukraine | 811,000 | 1,680,110 | 0 | 0 |
| 7 | Turkey | 747,065 | 1,344,717 | 0 | 0 |
| 8 | Singapore | 480,000 | 1,335,000 | -59 | -2.9 |
| 9 | Malaysia | 396,000 | 918,341 | -36.1 | 2.1 |
| 10 | Philippines | 252,000 | 656,280 | -14.9 | 50.7 |
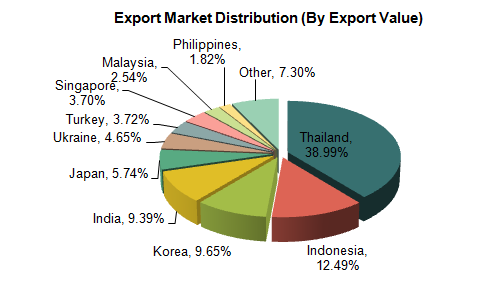
The data by 2012 exports shows that 2012 China Titanium ores and concentrates export value reached 36119 thousands USD, took a 186.3% growth rate as before. The major exports countries include Thailand, Indonesia, South Korea, India, Japan, Ukraine, Turkey, Singapore, Malaysia and Philippines. As the biggest exports market, the export value to Thailand held 38.99% of whole market, and Indonesia is second with 12.5%.
The export value & volume and major export countries/regions for Ash and residues (other than from the manufacture of iron or steel), containing arsenic, metals or their compounds - (Ranked by export value)
| No. | Country/Region | Total from Jan. to Dec. | Compared with the same period of last year | ||
|
|
| Volume(Kg) | Value(USD) | Volume | Value |
| 1 | Unite States | 23,789,910 | 13,371,790 | 801.2 | 843.8 |
| 2 | Japan | 12,464,550 | 3,791,439 | 7.1 | 25.9 |
| 3 | South Africa | 1,505,500 | 893,133 | 30.3 | 28.6 |
| 4 | South Korea | 2,180,470 | 624,962 | 188.4 | 88.2 |
| 5 | Italy | 1,883,960 | 433,435 | -0.7 | -5.2 |
| 6 | Canada | 1,527,000 | 421,919 | -88.1 | -93.7 |
| 7 | HK | 2,448,280 | 138,271 | -71.8 | -71 |
| 8 | Sweden | 22,000 | 125,916 | 214.6 | 107.4 |
| 9 | Germany | 128,168 | 53,877 | -33.1 | -69.8 |
| 10 | Iran | 50,000 | 35,500 | 0 | 0 |
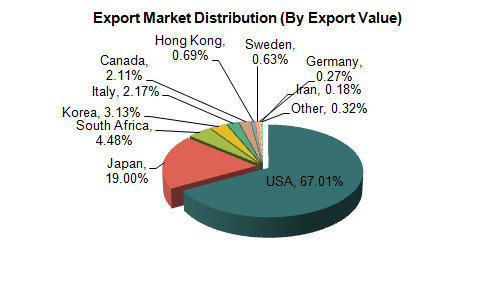
The data by 2012 exports shows that 2012 China Ash and residues (other than from the manufacture of iron or steel), containing arsenic, metals or their compounds export value reached 19953 thousands USD, took a 42.8% growth rate as before. The major exports countries include USA, Japan, South Africa, South Korea, Italy, Canada, HK, Sweden, Germany and Iran. As the biggest exports market, the export value to USA held 67.01% of whole market.
Data Source: China Custom


