Annual Import and Export Trends of Global Knitting Machinery (HS: 8447), 2009-2011
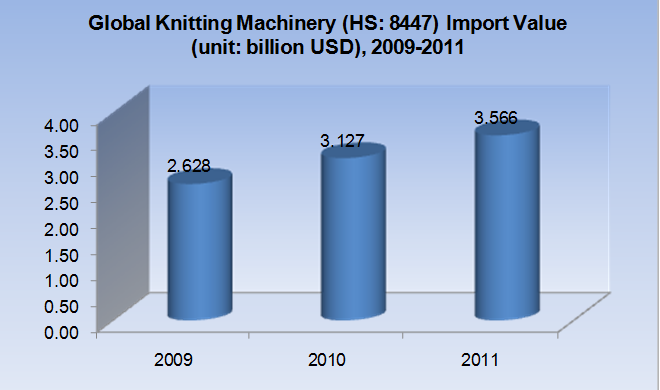
Total import value of global knitting machinery grew year by year from 2009 to 2011, of which, in 2011 imports amounted to approximately $ 3.566 billion, achieving an increase of 14.06%.
Import Value of Main Countries/ Regions Demand for Knitting Machinery (HS: 8447), 2009-2011
| No. | Countries/Regions | Import Value (million USD) | Growth of 2011 compared with 2009 | ||
| 2009 | 2010 | 2011 | |||
| 1 | China | 849 | 1020 | 1143 | 34.57% |
| 2 | India | 390 | 318 | 396 | 1.48% |
| 3 | Turkey | 78 | 218 | 337 | 330.52% |
| 4 | Hongkong | 220 | 141 | 161 | -26.59% |
| 5 | Bengal | 81 | 117 | 123 | 52.74% |
| 6 | The USA | 71 | 100 | 113 | 59.26% |
| 7 | Brazil | 79 | 111 | 108 | 36.36% |
| 8 | Italy | 76 | 72 | 83 | 9.17% |
| 9 | Indonesia | 41 | 54 | 74 | 81.45% |
| 10 | Pakistan | 46 | 67 | 69 | 49.60% |
| 11 | Russia | 22 | 43 | 66 | 205.27% |
| 12 | South Korea | 18 | 40 | 60 | 235.86% |
| 13 | Taiwan | 20 | 40 | 56 | 183.35% |
| 14 | Thailand | 29 | 44 | 55 | 88.81% |
| 15 | Vietnam | 68 | 44 | 47 | -30.43% |
| 16 | Mexico | 28 | 36 | 37 | 32.45% |
| 17 | Japan | 29 | 24 | 35 | 20.12% |
| 18 | Cambodian | 26 | 52 | 32 | 25.17% |
| 19 | Germany | 19 | 20 | 32 | 68.01% |
| 20 | The UK | 16 | 21 | 22 | 42.81% |
As the world's largest importing country for knitting machinery, China's imports value of knitting machinery was about $ 1.143 billion in 2011, an increase of 12.12% compared with 2010. India and Turkey were the second and the third, whose imports grew by 24.46% and 54.78% respectively in 2011. In the three years, among all of the world's top 20 knitting machinery importing countries, Turkey and South Korea got largest import value increase, which were 330.52% and 235.86% in 2011 compared to 2009.
Market Share of Main Countries/ Regions Demand for Knitting Machinery (HS: 8447), 2009-2011
| No. | Countries/Regions | Market Share | ||
| 2009 | 2010 | 2011 | ||
| 1 | China | 32.32% | 32.61% | 32.05% |
| 2 | India | 14.86% | 10.18% | 11.11% |
| 3 | Turkey | 2.98% | 6.97% | 9.46% |
| 4 | Hongkong | 8.36% | 4.51% | 4.52% |
| 5 | Bengal | 3.07% | 3.74% | 3.46% |
| 6 | The USA | 2.70% | 3.21% | 3.17% |
| 7 | Brazil | 3.01% | 3.57% | 3.03% |
| 8 | Italy | 2.88% | 2.30% | 2.32% |
| 9 | Indonesia | 1.55% | 1.74% | 2.07% |
| 10 | Pakistan | 1.76% | 2.14% | 1.94% |
| 11 | Russia | 0.82% | 1.39% | 1.84% |
| 12 | South Korea | 0.68% | 1.29% | 1.69% |
| 13 | Taiwan | 0.75% | 1.28% | 1.57% |
| 14 | Thailand | 1.10% | 1.40% | 1.53% |
| 15 | Vietnam | 2.59% | 1.42% | 1.33% |
| 16 | Mexico | 1.06% | 1.15% | 1.03% |
| 17 | Japan | 1.11% | 0.77% | 0.98% |
| 18 | Cambodian | 0.97% | 1.66% | 0.90% |
| 19 | Germany | 0.72% | 0.65% | 0.89% |
| 20 | The UK | 0.59% | 0.68% | 0.63% |
Note: "↑"indicates continuous increase of market share the country's import value takes in global total, and"↓"indicates continuous decrease of market share the country's import value takes in global total
Seen from the import value's market share, Turkey, Italy, Indonesia, Russia, South Korea, Taiwan and Thailand got continuous increase from 2009 to 2011, while Vietnam declined year by year.
Export Value of Main Countries / Regions Demand for Global Knitting Machinery (HS: 8447), 2009-2011
| No. | Countries/Regions | Export Value (million USD) | Growth of 2011 compared with 2009 | ||
| 2009 | 2010 | 2011 | |||
| 1 | Germany | 7,360 | 9,294 | 11,812 | 60.49% |
| 2 | China | 4,590 | 4,796 | 6,133 | 33.62% |
| 3 | Japan | 4,032 | 5,548 | 5,720 | 41.89% |
| 4 | Italy | 2,214 | 3,971 | 4,356 | 96.77% |
| 5 | Hongkong | 3,106 | 1,252 | 1,737 | -44.06% |
| 6 | Taiwan | 942 | 1,474 | 1,497 | 58.94% |
| 7 | South Korea | 928 | 1,083 | 1,262 | 35.90% |
| 8 | The USA | 518 | 945 | 917 | 77.22% |
| 9 | Switzerland | 755 | 807 | 864 | 14.51% |
| 10 | The UK | 245 | 253 | 273 | 11.35% |
| 11 | Turkey | 268 | 161 | 191 | -28.71% |
| 12 | Spain | 182 | 205 | 181 | -0.08% |
| 13 | Singapore | 182 | 199 | 155 | -14.94% |
| 14 | Netherland | 68 | 79 | 101 | 47.86% |
| 15 | France | 140 | 125 | 94 | -32.82% |
| 16 | Poland | 52 | 142 | 89 | 73.28% |
| 17 | Austria | 72 | 30 | 66 | -8.07% |
| 18 | Croatia | 2 | 21 | 48 | 2810.24% |
| 19 | Czech Republic | 71 | 58 | 48 | -33.02% |
| 20 | Greece | 32 | 64 | 45 | 42.70% |
Germany is the world's largest exporter of knitting machinery. In 2011, German knitting machinery exports accounted for 32.65% of the world's total. 2009-2011, among the world's top 20 largest knitting machinery export supply countries, Croatia grew by 2810.24% in 2011 compared to 2009 and ranked first.
Market Share of Main Export Countries/Regions of Global Knitting Machinery (HS: 8447), 2009-2011
| No. | Countries/Regions | Market Share | ||
| 2009 | 2010 | 2011 | ||
| 1 | Germany↑ | 27.74% | 29.78% | 32.65% |
| 2 | China | 17.30% | 15.37% | 16.95% |
| 3 | Japan | 15.20% | 17.78% | 15.81% |
| 4 | Italy | 8.35% | 12.72% | 12.04% |
| 5 | Hongkong | 11.71% | 4.01% | 4.80% |
| 6 | Taiwan | 3.55% | 4.72% | 4.14% |
| 7 | South Korea | 3.50% | 3.47% | 3.49% |
| 8 | The USA | 1.95% | 3.03% | 2.54% |
| 9 | Switzerland | 2.84% | 2.59% | 2.39% |
| 10 | The UK | 0.92% | 0.81% | 0.75% |
| 11 | Turkey | 1.01% | 0.52% | 0.53% |
| 12 | Spain | 0.68% | 0.66% | 0.50% |
| 13 | Singapore | 0.68% | 0.64% | 0.43% |
| 14 | Netherland | 0.26% | 0.25% | 0.28% |
| 15 | France | 0.53% | 0.40% | 0.26% |
| 16 | Poland | 0.19% | 0.46% | 0.25% |
| 17 | Austria | 0.27% | 0.10% | 0.18% |
| 18 | Croatia | 0.01% | 0.07% | 0.13% |
| 19 | Czech Republic | 0.27% | 0.19% | 0.13% |
| 20 | Greece | 0.12% | 0.21% | 0.12% |
Note: "↑"indicates continuous increase of market share the country's export value takes in global total, and" ↓"indicates continuous decrease of market share the country's export value takes in global total.
Seen from the export value's market share, Germany and Croatia got continuous increase from 2009 to 2011, while Switzerland, the UK, Spain, Singapore, France and the Czech Republic declined year by year.


