2.1. Chinese Export Quantity and Value of Generators (HS:8501)in Jan. - May, 2012
| Month | Quantity(hundred million sets) | Value(hundred million dollars) | Year-on-Year ±% | |
|
|
|
| Quantity | Value |
| 1 | 2.22 | 7.29 | -28.2 | -0.2 |
| 2 | 2.14 | 6.01 | 11.3 | 25.8 |
| 3 | 2.70 | 8.33 | -13.2 | 14.9 |
| 4 | 2.55 | 8.04 | -15.6 | 6.9 |
| 5 | 2.65 | 8.63 | -10.1 | 16.9 |
| Total | 12.26 | 38.30 | -13 | 11.9 |
2.2. Chinese Major Export Countries/Regions of Generators(HS:8501) in Jan. - May, 2012
| No. | Countries/Regions | Total in Jan. - May,2012 | Year-on-Year ±% | ||
|
|
| Quantity(set) | Value(thousand dollars) | Quantity | Value |
| 1 | USA | 84,733,094 | 651,746.4 | 16.8 | 25.5 |
| 2 | Hong Kong | 581,218,941 | 524,522.3 | -16.5 | 7.4 |
| 3 | Japan | 147,869,607 | 427,734.9 | -4.1 | 15.1 |
| 4 | Germany | 50,472,387 | 210,077.7 | -26.2 | 18.1 |
| 5 | Italy | 21,279,137 | 159,492.0 | -11.6 | -0.7 |
| 6 | Thailand | 25,600,123 | 147,901.3 | -16.9 | 22.6 |
| 7 | Republic of Korea | 60,535,849 | 144,442.4 | -10.8 | 2.3 |
| 8 | India | 10,119,980 | 127,638.6 | -7.6 | 5.8 |
| 9 | Turkey | 13,015,939 | 96,788.5 | -1.4 | 0.5 |
| 10 | Indonesia | 8,715,953 | 80,418.5 | 1.4 | 5.8 |
| 11 | Malaysia | 13,341,372 | 74,365.5 | -27.9 | 0.3 |
| 12 | United Kingdom | 3,430,076 | 69,091.1 | 8.4 | 32 |
| 13 | Brazil | 15,596,329 | 66,600.3 | -17.1 | 3.7 |
| 14 | Mexico | 19,565,000 | 65,524.7 | -2.2 | 39.2 |
| 15 | Spain | 2,825,689 | 54,531.1 | 2.5 | 15.6 |
| 16 | Canada | 10,256,526 | 52,184.2 | 9.1 | 21.5 |
| 17 | Russian Federation | 3,472,255 | 49,972.4 | -30.4 | -3.2 |
| 18 | France | 5,063,045 | 48,195.8 | -47.6 | 7.8 |
| 19 | Poland | 3,865,634 | 41,499.1 | 51.4 | 117.4 |
| 20 | Netherlands | 27,024,577 | 41,461.2 | -18.4 | -21.6 |
2.3. Chinese Major Export Sourcing Regions of Generators(HS:8501)in Jan. - May, 2012
| NO. | Regions | Total in Jan. – May,2012 | Year-on-Year ±% | Proportion (%) | ||
|
|
| Quantity(set) | Value(thousand dollars) | Quantity | Value |
|
| 1 | Guangdong | 828,881,776 | 1,372,432.4 | -17 | 10.7 | 35.83% |
| 2 | Zhejiang | 84,317,548 | 714,918.2 | 0.5 | 16.5 | 18.66% |
| 3 | Jiangsu | 84,841,359 | 668,701.2 | 44.2 | 19 | 17.46% |
| 4 | Shanghai | 33,205,306 | 317,025.5 | -43.6 | -0.2 | 8.28% |
| 5 | Fujian | 26,871,046 | 199,153.1 | -11.1 | -8 | 5.20% |
| 6 | Liaoning | 116,903,959 | 160,077.7 | -13.6 | 28 | 4.18% |
| 7 | Shandong | 8,456,039 | 116,659.4 | -16.1 | 21.8 | 3.05% |
| 8 | Tianjin | 21,983,686 | 99,010.1 | -0.3 | 16.6 | 2.58% |
| 9 | Hunan | 5,850,770 | 37,854.2 | 44.4 | 28.5 | 0.99% |
| 10 | Hebei | 404,264 | 32,177.5 | -8 | -12.6 | 0.84% |
| 11 | Beijing | 130,804 | 16,354.7 | -55.7 | -27.8 | 0.43% |
| 12 | Sichuan | 3,262 | 13,525.4 | -13 | 258.1 | 0.35% |
| 13 | Anhui | 1,933,683 | 12,274.1 | 424.8 | 45.8 | 0.32% |
| 14 | Jiangxi | 1,351,653 | 11,690.2 | 18.3 | 79.4 | 0.31% |
| 15 | Henan | 13,152 | 10,247.0 | 55.7 | 40.7 | 0.27% |
| 16 | Chongqing | 1,071,064 | 9,903.7 | -62.5 | 7.3 | 0.26% |
| 17 | Hubei | 1,117,799 | 9,019.3 | -16.8 | -14.6 | 0.24% |
| 18 | Shanxi | 95,463 | 7,031.1 | 1199.7 | 62.7 | 0.18% |
| 19 | Heilongjiang | 373 | 5,697.5 | -99.9 | -47.4 | 0.15% |
| 20 | Guangxi | 8,097,017 | 4,046.8 | 374242 | 1184.4 | 0.11% |
From Jan. to May in 2012, the Chinese export Quantity and Value of generators reached 1.226 billion sets and $3.83 billion, down 13% and up 11.9% over the same period last year respectively.
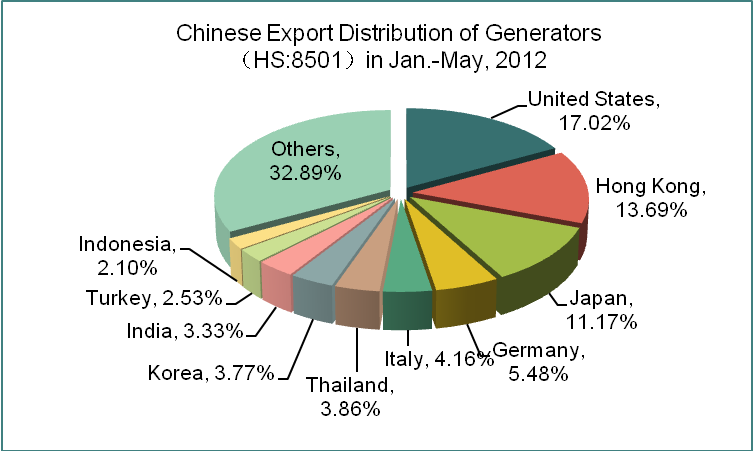
The major export countries/regions include USA, Hong Kong, Japan, Germany, Italy, Thailand, Republic of Korea, India, Turkey and Indonesia, etc.
The major export sourcing regions include Guangdong, Zhejiang and Jiangsu province, and Guangdong’s export accounts for 35.83% of the total export value from Jan. - May.


