2010-2012 Chinese Computer Trend Analysis of Export Volume

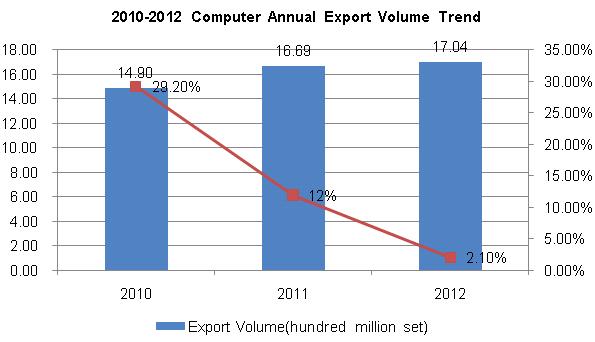
2010-2012 Chinese computer exports continued to grow. During 2013 January to June, the exports amounted to 1.704 billion units. However, export volume is declining year by year, 2010-2012 export volumes have increased by 29.2%, 12% and 2.1% respectively.

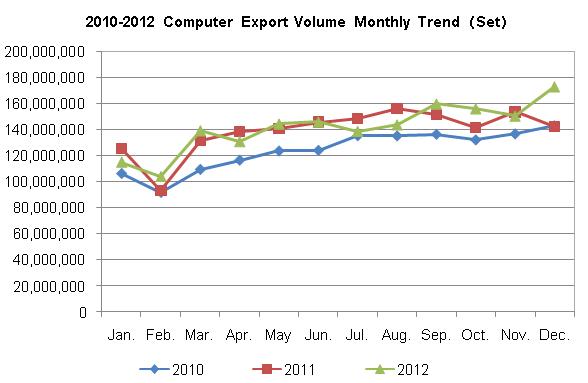
With the view of 2010-2012 monthly China computer export volume chart, we can see that in 2012 the export volume peaked in December, exports low ebb in February.
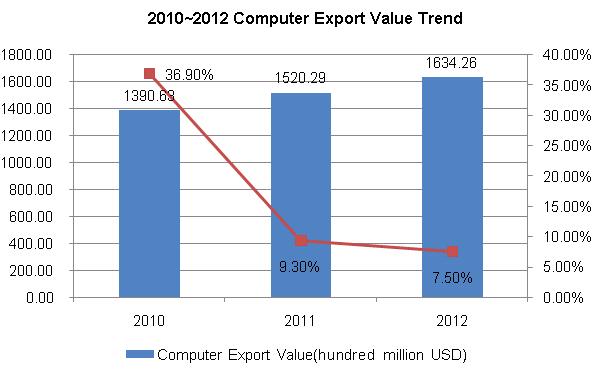
2010-2012 Trend Analysis of the China Computer Export Value


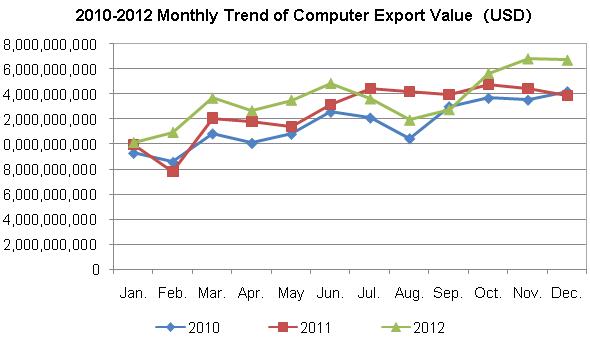
With the view of 2010-2012 monthly export value of China's computer chart, we can see that in 2012 the export value peaked in December, exports low ebb in February.
2010-2012 Computer Export Unit Value Trend
| No. | Country/Region | Export Sum (USD) | 2012 VS 2010 | ||
| 2010 | 2011 | 2012 | |||
| 1 | USA↑ | 42,743,429,736 | 48,719,733,115 | 50,316,296,240 | 17.72% |
| 2 | Hong Kong↑ | 21,078,683,035 | 24,620,925,922 | 31,513,364,593 | 49.50% |
| 3 | Netherlands | 12,107,865,582 | 13,947,684,525 | 13,875,462,976 | 14.60% |
| 4 | Japan↑ | 7,030,171,204 | 8,568,905,424 | 9,458,079,090 | 34.54% |
| 5 | Germany↑ | 7,804,469,757 | 8,085,284,357 | 9,116,509,469 | 16.81% |
| 6 | UK | 4,176,793,760 | 3,403,122,533 | 4,333,132,572 | 3.74% |
| 7 | Singapore↑ | 3,206,424,414 | 3,316,982,182 | 3,654,703,743 | 13.98% |
| 8 | South Korea↓ | 4,263,981,876 | 3,408,857,719 | 3,144,900,196 | -26.24% |
| 9 | Australia | 2,921,661,390 | 3,407,695,055 | 3,053,458,329 | 4.51% |
| 10 | UAE↑ | 2,077,725,058 | 2,516,760,720 | 2,976,427,615 | 43.25% |
Notice: “↑”indicate the continued rise during 2010-2012, “↓”indicate the continued decline during 2010--2012
2010-2012, Chinese computer top 3 export markets are the United States, Hong Kong and the Netherlands. In China's top 10 export markets, the export value to the United States, Hong Kong, Japan, Germany, Singapore and the UAE continues to grow in 2010-2012, the export value to South Korea continued to decline, South Korea is also in the top ten export markets, and the only one in decrease in 2012, which compared to 2010 exports amounted country.
2010-2012 China Movement Trend of Computer Export Market Share
| No. | Country/Region | Export Sum Proportion | ||
| 2010 | 2011 | 2012 | ||
| 1 | USA | 30.74% | 32.05% | 30.79% |
| 2 | Hong Kong↑ | 15.16% | 16.19% | 19.28% |
| 3 | Netherlands | 8.71% | 9.17% | 8.49% |
| 4 | Japan↑ | 5.06% | 5.64% | 5.79% |
| 5 | Germany | 5.61% | 5.32% | 5.58% |
| 6 | UK | 3.00% | 2.24% | 2.65% |
| 7 | Singapore | 2.31% | 2.18% | 2.24% |
| 8 | South Korea↓ | 3.07% | 2.24% | 1.92% |
| 9 | Australia | 2.10% | 2.24% | 1.87% |
| 10 | UAE↑ | 1.49% | 1.66% | 1.82% |
Notice: “↑”indicate the continued rise during 2010-2012, “↓”indicate the continued decline during 2010--2012
2010-2012, China continued to increase the computer export value account for the total exports in the area of Hong Kong, Japan and the UAE. The share of South Korea's exports declined year by year.
Source: Customs Information Network


