China Telecommunication & Broadcasting Industry Export Value from Jan. to March 2013
| HS Code | Product Name | Volume (10 Thousand Units) | Value (100 Million USD) | Year on year | |
| Volume | Value | ||||
| 8525 | Transmission apparatus for radio broadcasting or television, whether or not incorporating reception apparatus or sound recording or reproducing apparatus; television cameras, digital cameras and video camera recorders (Hereinafter referred to as "radio, television transmission apparatus; television cameras, digital cameras and video camcorders.") | 19,928.00 | 26.70 | 8.2% | -0.7% |
| 8526 | Radar apparatus, radio navigational aid apparatus and radio remote control apparatus | 1,379.00 | 4.74 | 33.1% | 6.2% |
| 8527 | Reception apparatus for radio broadcasting, whether or not combined, in the same housing, with sound recording or reproducing apparatus or a clock (Hereinafter referred to as "radio receiving equipment.") | 5,129.47 | 9.88 | -5.1% | -7.2% |
| 8528 | Monitors and projectors, not incorporating television reception apparatus: reception apparatus for television, whether or not incorporating radio broad cast receivers or sound or video recording or reproducing apparatus (Hereinafter referred to as "monitors and projectors, television receiving apparatus") | 6,044.29 | 56.53 | 0.0% | -8.4% |
Radio, Television Transmission Apparatus; Television Cameras, Digital Cameras and Video Camcorders export volume of the first quarter of 2013 is 199.28 million units, with an increase of 8.2%; the export value is about 2.67 billion dollars, with a decrease of 0.7%.
Radar Apparatus, Radio Navigational Aid Apparatus and Radio Remote Control Apparatus export volume of the first quarter of 2013 is 13.79 million units, with an increase of 33.1%; the export value is about 474 million dollars, with an increase of 6.2%.
Radio Receiving Equipment export volume of the first quarter of 2013 is 51.2947 million units, with a decrease of 5.1%; the export value is about 988 million dollars, with a decrease of 7.2%.
Monitors and Projectors, Television Receiving Apparatus of the first quarter of 2013 is 60.4429 million units; the export value is about 5.653 billion dollars, with a decrease of 8.4%.
China Radio, Television Transmission Apparatus; Television Cameras, Digital Cameras and Video Camcorders Export Situation Analysis in the First Quarter of 2013
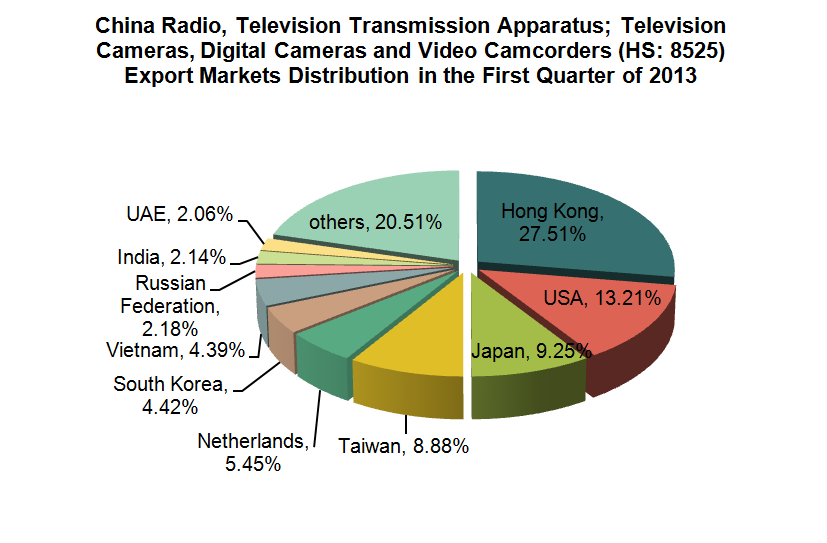
China Radio, Television Transmission Apparatus; Television Cameras, Digital Cameras and Video Camcorders (HS: 8525) Main Export Countries and Regions Distribution from Jan. to March 2013 (Sort by Export Value)
| No. | Country | Volume (Million Unit) | Value (100 Million USD) | Year on year | |
| Volume | Value | ||||
| 1 | Hong Kong | 99.76 | 7.34 | 20.3% | 31.9% |
| 2 | USA | 8.41 | 3.53 | -3.8% | -23.5% |
| 3 | Japan | 3.36 | 2.47 | -29.8% | -30.2% |
| 4 | Taiwan | 5.42 | 2.37 | 134.3% | 847.5% |
| 5 | Netherlands | 2.64 | 1.46 | -29.5% | -32.2% |
| 6 | South Korea | 15.60 | 1.18 | -21.0% | -5.5% |
| 7 | Vietnam | 22.45 | 1.17 | 83.6% | 51.7% |
| 8 | Russian Federation | 1.07 | 0.58 | -32.6% | -18.1% |
| 9 | India | 4.99 | 0.57 | 5.7% | 15.8% |
| 10 | UAE | 0.89 | 0.55 | 14.1% | 30.9% |
| 11 | Germany | 1.07 | 0.54 | -51.3% | -50.5% |
| 12 | Singapore | 16.78 | 0.51 | -31.5% | -33.1% |
| 13 | United Kingdom | 0.80 | 0.43 | -31.6% | -34.8% |
| 14 | Brazil | 6.11 | 0.33 | 41.8% | 22.4% |
| 15 | France | 0.43 | 0.31 | -9.3% | 15.0% |
| 16 | Canada | 0.68 | 0.26 | 15.9% | -31.7% |
| 17 | Mexico | 1.01 | 0.23 | 30.1% | -18.8% |
| 18 | Thailand | 0.50 | 0.21 | -1.2% | 5.1% |
| 19 | Malaysia | 0.60 | 0.19 | 12.8% | 121.2% |
| 20 | Italy | 0.32 | 0.17 | -24.0% | -17.4% |
China Radio, Television Transmission Apparatus; Television Cameras, Digital Cameras and Video Camcorders (HS: 8525) Main Export Source Areas Distribution from Jan. to March 2013 (Sort by Export Value)
| Regions | Volume in Proportion | Value in Proportion | Year on year | |
| Volume | Value | |||
| Guangdong | 61.7% | 44.9% | 7.4% | 4.3% |
| Jiangsu | 8.8% | 25.9% | 7.2% | -9.8% |
| Tianjin | 14.3% | 15.6% | 51.4% | 34.0% |
| Shanghai | 1.5% | 4.4% | 77.3% | -36.6% |
| Zhejiang | 2.1% | 2.4% | 13.9% | 49.9% |
In the first quarter of 2013, China Radio, Television Transmission Apparatus; Television Cameras, Digital Cameras and Video Camcorders main exporting countries/regions are Hong Kong, the United States, Japan, Taiwan, the Netherlands, Korea, Vietnam, Russia, India, the United Arab Emirates, Germany, Singapore, the United Kingdom, Brazil, France, Canada, Mexico, Thailand, Malaysia and Italy. Among them, the export value to Hong Kong accounted for 27.5% of the products total exports of the first quarter, while the United States accounting for 13.2%.
Major export source areas concentrated in Guangdong, Jiangsu and Tianjin.
China Radar Apparatus, Radio Navigational Aid Apparatus and Radio Remote Control Apparatus Export Situation Analysis in the First Quarter of 2013
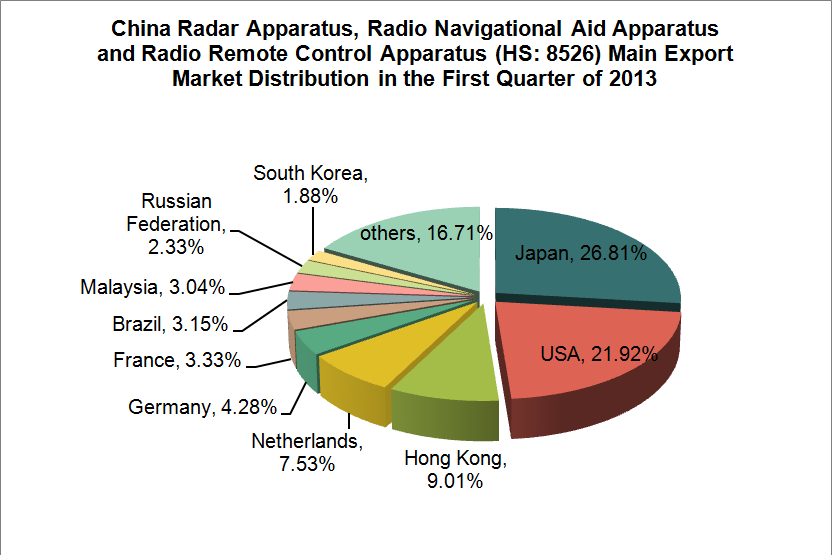
China Radar Apparatus, Radio Navigational Aid Apparatus and Radio Remote Control Apparatus (HS: 8526) Main Export Countries and Regions Distribution from Jan. to March 2013 (Sort by Export Value)
| No. | Country | Volume (10 Thousand Units) | Value (10 Million USD) | Year on year | |
| Volume | Value | ||||
| 1 | Japan | 75.90 | 12.71 | -5.2% | 12.3% |
| 2 | USA | 299.65 | 10.39 | 19.1% | -2.8% |
| 3 | Hong Kong | 138.20 | 4.27 | -4.4% | -15.1% |
| 4 | Netherlands | 88.10 | 3.57 | -11.4% | -14.4% |
| 5 | Germany | 99.06 | 2.03 | -11.8% | -13.5% |
| 6 | France | 20.86 | 1.58 | -16.2% | -31.5% |
| 7 | Brazil | 23.26 | 1.49 | 8.5% | 34.0% |
| 8 | Malaysia | 49.87 | 1.44 | 258.1% | 135.6% |
| 9 | Russian Federation | 27.73 | 1.11 | 65.2% | 152.2% |
| 10 | South Korea | 29.77 | 0.89 | 96.4% | 63.5% |
| 11 | Belgium | 2.61 | 0.81 | 57.9% | 535.3% |
| 12 | Australia | 17.43 | 0.61 | 4.1% | -0.1% |
| 13 | Niger | 0.04 | 0.57 | 0.0% | 0.0% |
| 14 | United Kingdom | 50.47 | 0.57 | 12.9% | 28.7% |
| 15 | Indonesia | 52.59 | 0.51 | 1502.8% | 55.5% |
| 16 | India | 61.47 | 0.44 | 309.1% | 232.6% |
| 17 | Philippines | 1.83 | 0.38 | 81.2% | 159.7% |
| 18 | Thailand | 27.96 | 0.38 | 374.1% | 285.4% |
| 19 | Portugal | 30.40 | 0.30 | 160.0% | 112.2% |
| 20 | Saudi Arabia | 5.68 | 0.28 | 101.0% | 6.3% |
China Radar Apparatus, Radio Navigational Aid Apparatus and Radio Remote Control Apparatus (HS: 8526) Main Source Areas from Jan. to March 2013 (Sort by Export Value)
| Region | Volume in Proportion | Value in Proportion | Year on year | |
| Volume | Value | |||
| Jiangsu | 15.3% | 37.8% | 13.7% | 13.8% |
| Guangdong | 56.6% | 32.1% | 53.5% | 12.9% |
| Shanghai | 18.0% | 25.0% | 10.9% | -6.6% |
| Hebei | 0.0% | 1.3% | -99.5% | 2746.6% |
| Fujian | 2.5% | 0.9% | -19.8% | -11.7% |
In the first quarter of 2013, China Radar Apparatus, Radio Navigational Aid Apparatus and Radio Remote Control Apparatus main exporting countries/regions are Japan, the United States, Hong Kong, Netherlands, Germany, France, Brazil, Malaysia, Russian Federation, South Korea, Belgium, Australia, Niger, the United Kingdom, Indonesia, India, the Philippines, Thailand, Portugal and Saudi Arabia. Among them, the export value to Japan accounted for 26.8% of the products total exports of the first quarter, while the United States accounting for 21.9%.
Major export source areas concentrated in Jiangsu, Guangdong and Shanghai.
China Radio Receiving Equipment Export Situation Analysis in the First Quarter of 2013
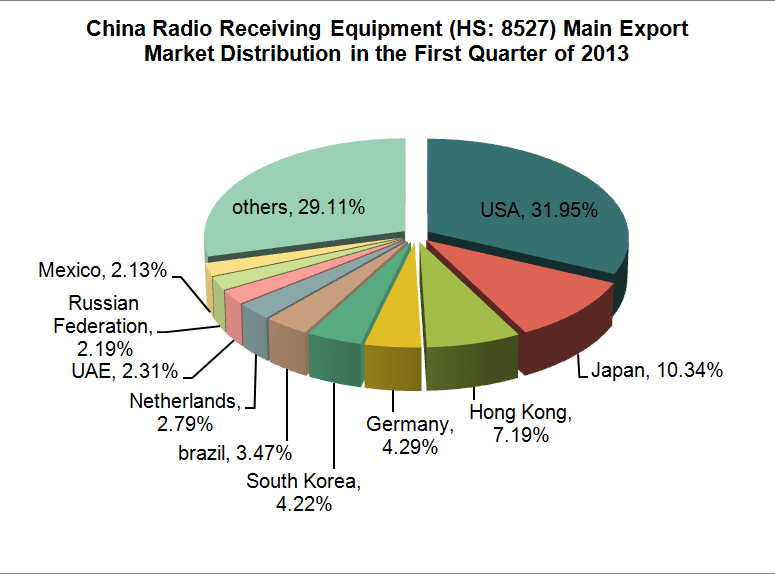
China Radio Receiving Equipment (HS: 8527) Main Export Countries and Regions Distribution from Jan. to March 2013 (Sort by Export Value)
| No. | County | Volume (Million Unit) | Value (10 Million USD) | Year on year | |
| Volume | Value | ||||
| 1 | USA | 6.75 | 31.57 | -14.1% | 3.8% |
| 2 | Japan | 1.84 | 10.22 | -31.0% | -27.9% |
| 3 | Hong Kong | 4.88 | 7.10 | -46.7% | -63.9% |
| 4 | Germany | 1.47 | 4.24 | 9.5% | 82.7% |
| 5 | South Korea | 0.75 | 4.17 | -13.5% | -10.7% |
| 6 | Brazil | 4.04 | 3.43 | 76.0% | 34.6% |
| 7 | Netherlands | 1.49 | 2.76 | -22.0% | -4.4% |
| 8 | UAE | 2.23 | 2.29 | -13.7% | 48.1% |
| 9 | Russian Federation | 1.40 | 2.16 | 134.0% | 77.3% |
| 10 | Mexico | 1.17 | 2.11 | 108.5% | 37.8% |
| 11 | Turkey | 0.51 | 1.60 | 84.8% | 293.4% |
| 12 | India | 0.75 | 1.52 | -42.6% | -2.4% |
| 13 | South Africa | 1.29 | 1.47 | 98.3% | 163.2% |
| 14 | Malaysia | 1.42 | 1.47 | -14.0% | 82.1% |
| 15 | Panama | 0.99 | 1.38 | 7.3% | -47.6% |
| 16 | United Kingdom | 0.63 | 1.32 | -17.4% | -19.8% |
| 17 | Australia | 0.51 | 1.31 | 13.6% | 6.4% |
| 18 | Thailand | 0.33 | 1.23 | -33.6% | -2.8% |
| 19 | France | 0.83 | 1.04 | -24.5% | -21.8% |
| 20 | Chile | 0.84 | 1.03 | 43.1% | 12.3% |
China Radio Receiving Equipment (HS: 8527) Main Source Areas from Jan. to March 2013 (Sort by Export Value)
| Region | Volume in Proportion | Value in Proportion | Year on year | |
| Volume | Value | |||
| Guangdong | 74.0% | 55.9% | -11.3% | -13.4% |
| Liaoning | 2.2% | 22.2% | -6.2% | 32.8% |
| Shanghai | 1.3% | 7.0% | -64.4% | -50.8% |
| Tianjin | 1.0% | 6.9% | 14.3% | 12.1% |
| Jiangsu | 0.7% | 3.6% | 13.3% | 27.9% |
In the first quarter of 2013, China Radio Receiving Equipment main exporting countries/regions are the United States, Japan, Hong Kong, Germany, South Korea, Brazil, the Netherlands, the United Arab Emirates, the Russian Federation, Mexico, Turkey, India, South Africa, Malaysia, Panama, the United Kingdom, Australia, Thailand, France and Chile. Among them, the export value to the United States accounted for 32% of the products total exports of the first quarter, while Japan accounting for 10.3%.
Major export source areas concentrated in Guangdong and Liaoning.
China Monitors and Projectors, Television Receiving Apparatus Export Situation Analysis in the First Quarter of 2013
China Monitors and Projectors, Television Receiving Apparatus (HS: 8528) Main Export Countries and Regions Distribution from Jan. to March 2013 (Sort by Export Value)
| No. | Country | Volume (Million Unit) | Value (100 Million USD) | Year on year | |
| Volume | Value | ||||
| 1 | USA | 10.47 | 16.44 | -22.3% | -19.8% |
| 2 | Netherlands | 4.06 | 5.86 | -21.0% | -12.4% |
| 3 | Japan | 1.86 | 4.46 | -35.3% | -22.6% |
| 4 | Hong Kong | 4.42 | 2.57 | 26.0% | -2.7% |
| 5 | India | 7.35 | 2.49 | 112.4% | 49.0% |
| 6 | UAE | 2.48 | 1.39 | -18.3% | -4.1% |
| 7 | United Kingdom | 1.37 | 1.35 | -27.1% | -20.3% |
| 8 | Germany | 1.18 | 1.32 | -54.2% | -14.7% |
| 9 | Brazil | 1.40 | 1.20 | 51.6% | 45.4% |
| 10 | South Korea | 0.81 | 1.09 | -20.5% | -27.6% |
| 11 | Australia | 0.60 | 1.05 | -8.8% | -8.1% |
| 12 | Taiwan | 0.62 | 1.02 | 37.3% | 55.3% |
| 13 | Russian Federation | 1.00 | 0.94 | 18.9% | -8.4% |
| 14 | Saudi Arabia | 0.92 | 0.94 | 123.5% | 100.1% |
| 15 | Singapore | 0.76 | 0.90 | 19.1% | 8.4% |
| 16 | Mexico | 0.52 | 0.90 | -23.1% | 42.5% |
| 17 | Vietnam | 1.88 | 0.73 | 269.1% | 258.6% |
| 18 | Thailand | 1.43 | 0.57 | -9.1% | 12.7% |
| 19 | Argentina | 0.35 | 0.53 | 134.3% | 135.4% |
| 20 | Canada | 0.29 | 0.52 | -39.2% | -32.3% |
China Monitors and Projectors, Television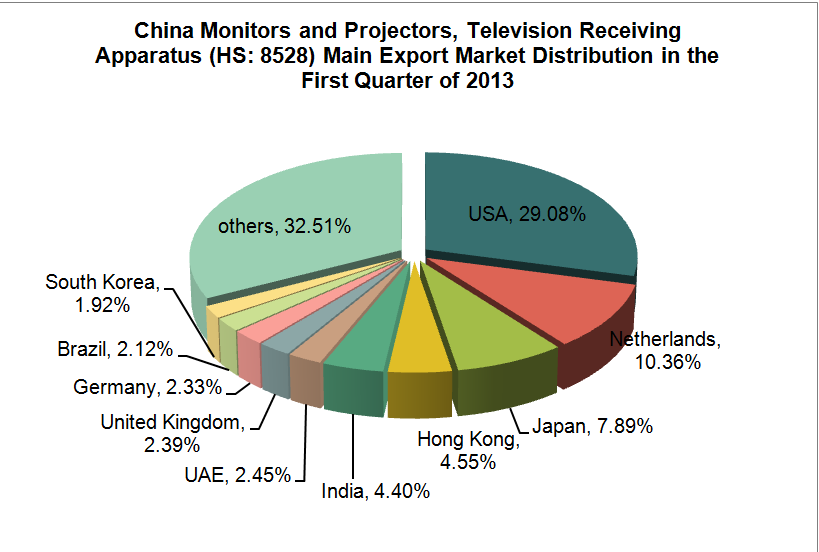
Main Source Areas from Jan. to March 2013
| Region | Volume in Proportion | Value in Proportion | Year on year | |
| Volume | Value | |||
| Guangdong | 49.9% | 39.4% | -1.8% | -7.5% |
| Jiangsu | 13.9% | 23.5% | -13.3% | -18.4% |
| Fujian | 16.7% | 15.0% | 5.6% | -2.2% |
| Shandong | 1.9% | 4.4% | 27.7% | 17.5% |
| Liaoning | 1.6% | 3.9% | -27.8% | -4.0% |
In the first quarter of 2013, China Monitors and Projectors, Television Receiving Apparatus main exporting countries/regions are the United States, the Netherlands, Japan, Hong Kong, India, the United Arab Emirates, United Kingdom, Germany, Brazil, South Korea, Australia, Taiwan, Russian Federation, Saudi Arabia , Singapore, Mexico, Vietnam, Thailand, Argentina and Canada. Among them, the export value to the United States accounted for 29.1% of the products total exports of the first quarter, while the Netherlands accounting for 10.4%.
Major export source areas concentrated in Guangdong, Jiangsu and Fujian.
Source: Customs Information Network