2010-2012 USA Toy (HS: 9503) Main Import Situation
2010-2012 USA Toy Import Trend
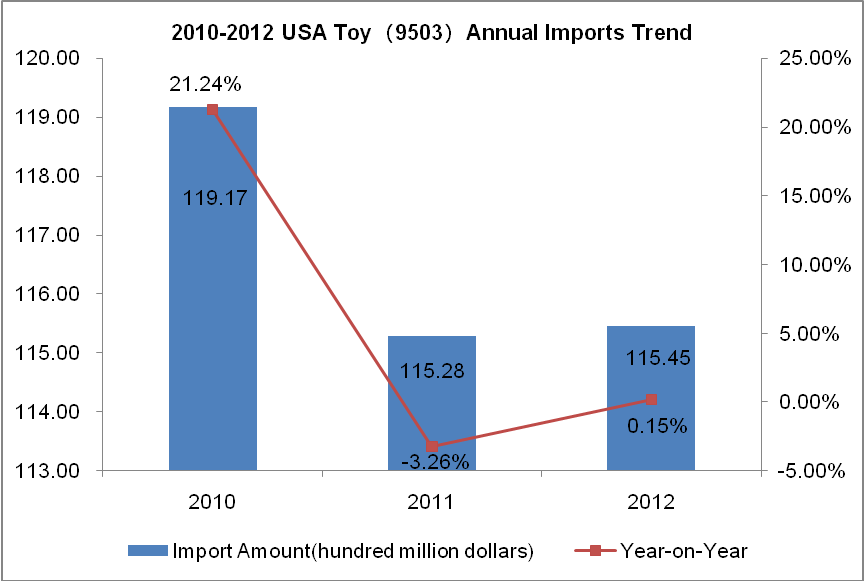
2010-2012 the amount of U.S. toy imports inverted "V" shape. Three years of imports amounted to $ 11.917 billion (an increase of 21.24%), $ 11.528 billion (down by 3.26%) and $ 11.545 billion (an increase of 0.15%).
2012 USA Toy Import Value Monthly Trend
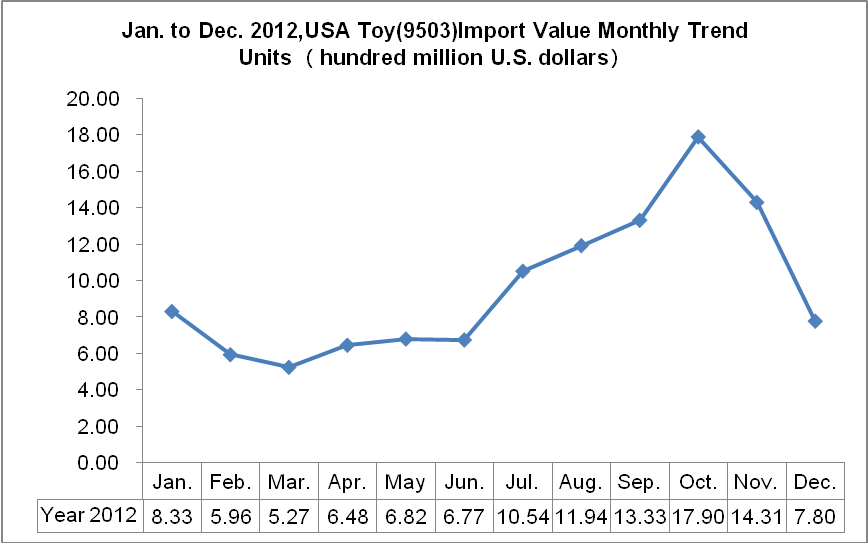
Jan. to Dec. 2012, the U.S. toy imports monthly trend shows that in the second half imports is significantly higher than the first half, in October, imports reached the annual maximum, $ 1.79 billion.
2012 USA Toy(HS:9503)Main Import Source
| No. | Country/Region | Import Value(thousand U.S. dollars) | Year-on-Year | Proportion |
|
| Total | 11,545,197 | 0.15% | 100.00% |
| 1 | China | 9,887,161 | -0.92% | 85.64% |
| 2 | Mexico | 575,396 | 56.76% | 4.98% |
| 3 | Indonesia | 201,222 | 8.61% | 1.74% |
| 4 | Chinese Taipei | 172,921 | 16.63% | 1.50% |
| 5 | Vietnam | 117,601 | 21.73% | 1.02% |
| 6 | Hong Kong | 82,019 | 6.31% | 0.71% |
| 7 | Canada | 78,166 | 26.38% | 0.68% |
| 8 | Denmark | 73,321 | -68.68% | 0.64% |
| 9 | Thailand | 70,719 | -2.75% | 0.61% |
| 10 | Germany | 52,776 | 8.43% | 0.46% |
2012 the top 10 USA toy import countries/regions are China,Mexico,Indonesia,Chinese Taipei,Vietnam,Hong Kong,Canada,Denmark,Thailand and Germany,the Imports from the above ten countries/regions accounted for 97.98 % of total imports. China is the main import source,in 2012,the toy import value from China accounted for USA imports that year the amount of 85.64%.
3.2.2010-2012 United Kingdom Toy (HS: 9503) Main Import Situation
2010-2012 United Kingdom Toy Import Value Trend
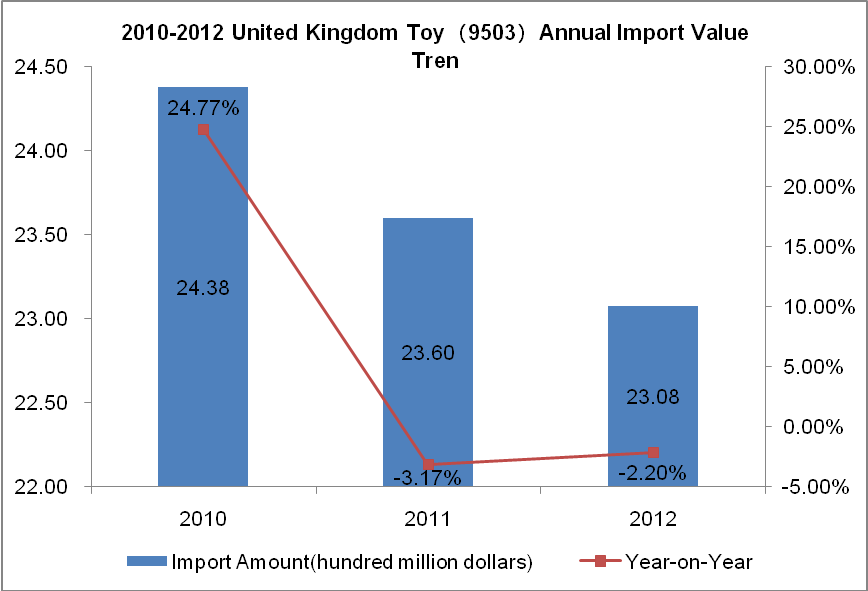
2010-2012 United Kingdom toy import value declined year by year. The Import value is respectively $ 2.438 billion (an increase of 24.77%), $ 2.36 billion (down by 3.17%) and $ 2.308 billion (down by 2.20%).
United Kingdom Toy Import Value Monthly Trend
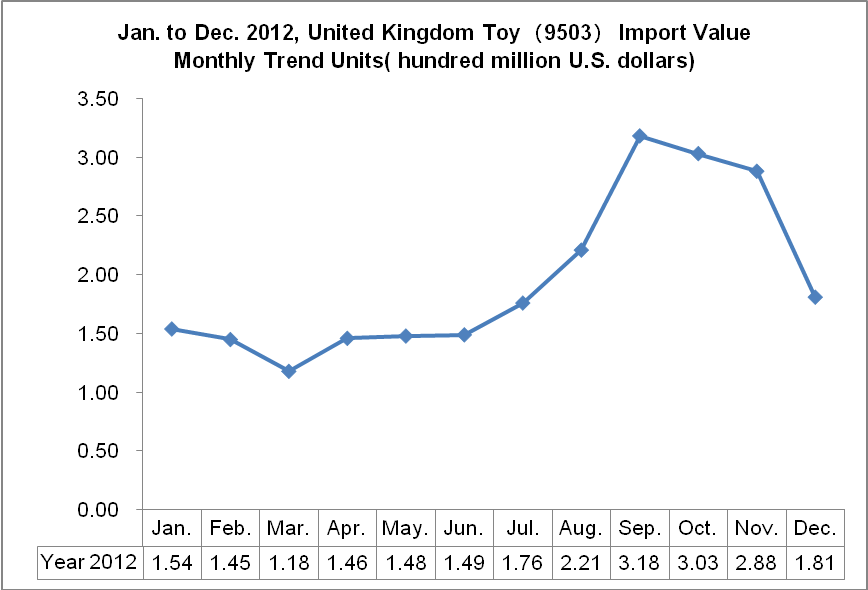
Jan. to Dec. 2012, United Kingdom Toy Import value monthly trend shows that the second half of imports is significantly higher than the first half .In September, imports reached the annual maximum, $ 318 million.
2012 United Kingdom Toy(HS:9503)Main Import Source
| No. | Country/Region | Import Value(thousand U.S. dollars) | Year-on-Year | Proportion |
|
| Total | 2,308,461 | -2.20% | 100.00% |
| 1 | China | 1,570,527 | -3.74% | 68.03% |
| 2 | Czech Republic | 213,389 | 25.32% | 9.24% |
| 3 | Hong Kong | 89,505 | -17.08% | 3.88% |
| 4 | Germany | 74,877 | -1.99% | 3.24% |
| 5 | USA | 46,270 | -11.33% | 2.00% |
| 6 | Ireland | 38,304 | -24.40% | 1.66% |
| 7 | Indonesia | 30,950 | 31.13% | 1.34% |
| 8 | Chinese Taipei | 30,765 | -6.11% | 1.33% |
| 9 | Netherlands | 20,458 | -28.39% | 0.89% |
| 10 | Vietnam | 19,886 | -19.80% | 0.86% |
2012 the top 10 United Kingdom toy import countries/regions are China,Czech Republic,Hong Kong,Germany,the USA,Ireland,Indonesia,Chinese Taipei,Netherlands and Vietnam,the Imports from the above ten countries/regions accounted for 92.48% of total imports. China is the main import source,in 2012,the toy import value from China accounted for United Kingdom imports that year the amount of 68.03%.
2010-2012Japan Toy (HS: 9503) Main Import Situation
2010-2012Japan Toy Import Trend
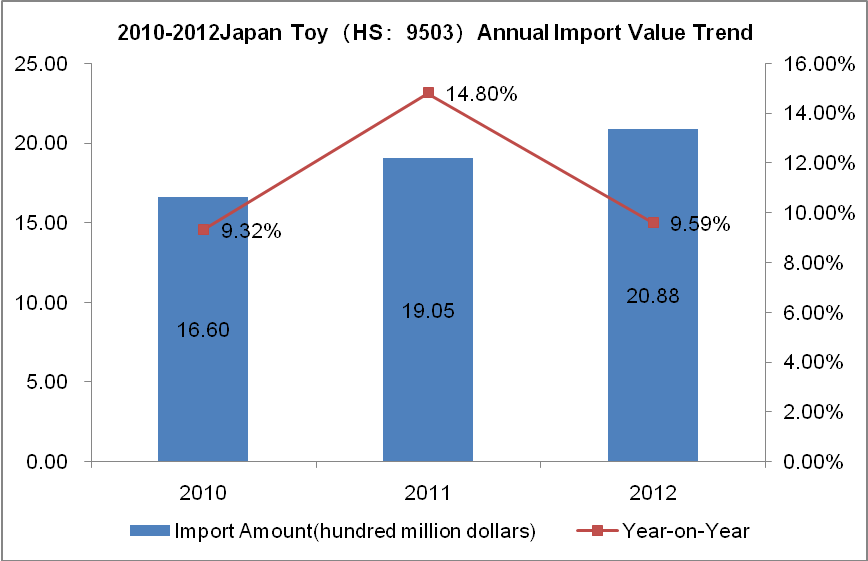
2010-2012 Japan Toy Import value increased year by year. The Import value is respectively $ 1.660 billion (an increase of 9.32%), $ 1.905 billion (up to 14.80%) and $ 2.088 billion (an increase of 9.59%).
Japan Toy Import Value Monthly Trend
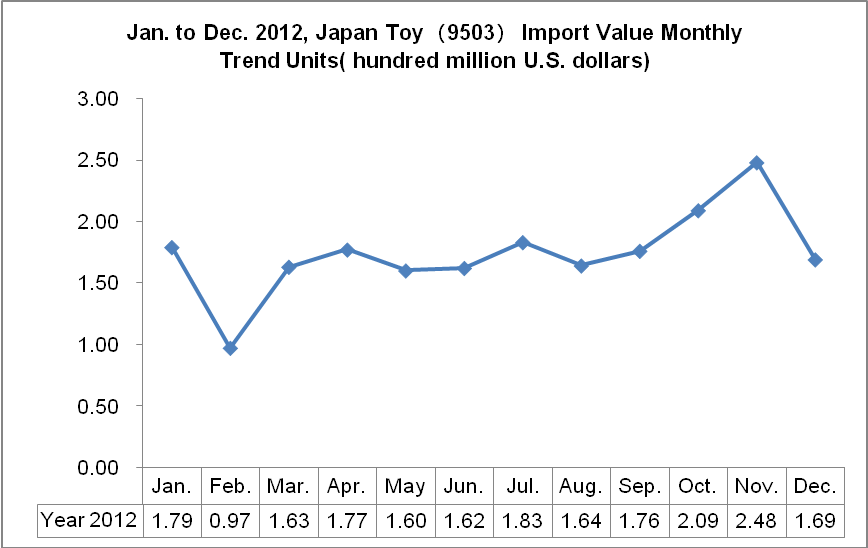
Jan. to Dec. 2012, Japan Toy Import value monthly trend shows that the highest amount of imports is in Nov. $ 248 million, and the lowest amount of imports is in Feb.$ 97million.
2012Japan Toy(HS:9503)Mani Import Source
| No. | Country/Region | Import Value(thousand U.S. dollars) | Year-on-Year | Proportion |
|
| Total | 2,087,966 | 9.59% | 100.00% |
| 1 | China | 1,794,939 | 7.90% | 85.97% |
| 2 | Vietnam | 78,340 | 73.34% | 3.75% |
| 3 | Thailand | 40,664 | -5.72% | 1.95% |
| 4 | Denmark | 35,278 | 26.56% | 1.69% |
| 5 | Chinese Taipei | 30,305 | 16.70% | 1.45% |
| 6 | Philippines | 18,231 | 51.61% | 0.87% |
| 7 | Germany | 13,104 | 0.85% | 0.63% |
| 8 | Czech Republic | 11,108 | -21.04% | 0.53% |
| 9 | Republic of Korea | 9,943 | -1.48% | 0.48% |
| 10 | USA | 9,442 | -4.44% | 0.45% |
2012 the top 10 Japan toy import countries/regions are China,Vietnam,Thailand,Denmark,Chinese Taipei,Philippines,Germany,Czech Republic,Republic of Korea and the USA, the Imports from the above ten countries/regions accounted for 97.77% of total imports. China is the main import source,in 2012,the toy import value from China accounted for Japan imports that year the amount of85.9%.
(Data Source: UN COMTRADE)


