The Trend of Global Demand for Piano from 2010 to 2012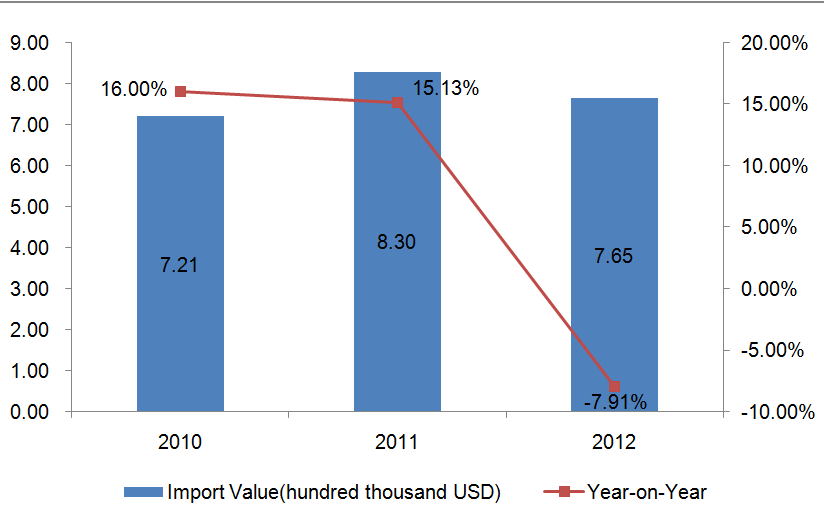
The import value of global piano trend was an inverted "V" shaped from 2010 to 2012. and the total import value of the three years amounted to 721 million US dollars, 830 million US dollars and 765 million US dollars respectively, among of which, the import value of 2012 decreased by 7.91% year on year, but increased by 6.03% compared to that of 2010.
Global Piano Major Import Countries/Regions from 2010 to 2012
| No. | Import Countries/Regions | Import Value (Thousand USD) | Import Value Growth Compared 2012 to 2010 | ||
|
|
| 2010 | 2011 | 2012 |
|
| 1 | China | 72,473 | 107,840 | 121,089 | 67.08% |
| 2 | USA | 118,178 | 118,835 | 115,351 | -2.39% |
| 3 | Germany | 62,775 | 79,443 | 72,770 | 15.92% |
| 4 | France | 44,378 | 50,065 | 38,259 | -13.79% |
| 5 | Japan | 25,068 | 30,715 | 32,553 | 29.86% |
| 6 | Canada | 32,106 | 35,148 | 32,453 | 1.08% |
| 7 | UK | 26,129 | 28,066 | 26,976 | 3.24% |
| 8 | Australia | 26,315 | 29,809 | 24,213 | -7.99% |
| 9 | Hong Kong | 22,668 | 25,806 | 21,754 | -4.03% |
| 10 | Switzerland | 19,463 | 22,835 | 21,347 | 9.68% |
| 11 | South Korea | 22,898 | 23,790 | 19,209 | -16.11% |
| 12 | Malaysia | 19,958 | 24,438 | 18,781 | -5.90% |
| 13 | The Russian Federation | 11,874 | 16,012 | 18,551 | 56.23% |
| 14 | Singapore | 15,206 | 18,215 | 16,257 | 6.91% |
| 15 | Italy | 20,757 | 19,372 | 14,404 | -30.61% |
| 16 | Vietnam | 11,066 | 8,145 | 11,507 | 3.99% |
| 17 | Belgium | 17,169 | 11,251 | 11,498 | -33.03% |
| 18 | Austria | 10,000 | 10,796 | 11,101 | 11.01% |
| 19 | Taiwan | 10,899 | 13,223 | 10,441 | -4.20% |
| 20 | Thailand | 8,189 | 8,260 | 9,388 | 14.64% |
China, the United States and Germany are the world's three largest piano import countries from 2010 to 2012. Among the global top twenty import markets in 2012, China's import value of piano increased by 67.08% compared to that of 2010, which was the largest increase, followed by the Russian Federation, the import value of which increased by 56.23% compared to that of 2010.
Global Piano Major Import Countries/Regions Market Share from 2010 to 2012
| No. | Import Countries/Regions | Import Value Percentage | ||
|
|
| 2010 | 2011 | 2012 |
| 1 | China↑ | 10.05% | 12.99% | 15.84% |
| 2 | USA | 16.39% | 14.31% | 15.09% |
| 3 | Germany | 8.71% | 9.57% | 9.52% |
| 4 | France↓ | 6.15% | 6.03% | 5.00% |
| 5 | Japan↑ | 3.48% | 3.70% | 4.26% |
| 6 | Canada | 4.45% | 4.23% | 4.24% |
| 7 | UK | 3.62% | 3.38% | 3.53% |
| 8 | Australia↓ | 3.65% | 3.59% | 3.17% |
| 9 | Hong Kong↓ | 3.14% | 3.11% | 2.85% |
| 10 | Switzerland↑ | 2.70% | 2.75% | 2.79% |
| 11 | South Korea↓ | 3.18% | 2.87% | 2.51% |
| 12 | Malaysia | 2.77% | 2.94% | 2.46% |
| 13 | The Russian Federation↑ | 1.65% | 1.93% | 2.43% |
| 14 | Singapore | 2.11% | 2.19% | 2.13% |
| 15 | Italy↓ | 2.88% | 2.33% | 1.88% |
| 16 | Vietnam | 1.53% | 0.98% | 1.50% |
| 17 | Belgium | 2.38% | 1.36% | 1.50% |
| 18 | Austria | 1.39% | 1.30% | 1.45% |
| 19 | Taiwan | 1.51% | 1.59% | 1.37% |
| 20 | Thailand | 1.14% | 0.99% | 1.23% |
Note: “↑”represents that the indicators listed continued to increase from 2010 to 2012, “↓”represents that the indicators listed continued to decrease from 2010 to 2012.
Judging from the market share, the import value in proportion of China, Japan, Switzerland and the Russian Federation continued to rise, while that of France, Australia, Hong Kong, South Korea and Italy continued to decline from 2010 to 2012.
Global Piano Major Demanding Countries from Jan. to June in 2013
| Major Import Countries/Regions | Import Value of Jan.-June 2013 (thousand US dollars) | YOY |
| USA | 62,845 | 7.39% |
| China | 55,773 | -0.10% |
| Germany | 33,187 | 3.83% |
| Japan | 15,226 | -10.40% |
| France | 14,843 | -15.87% |
| Canada | 14,812 | 2.45% |
| Australia | 13,420 | 7.41% |
| UK | 12,531 | 4.91% |
| Switzerland | 10,953 | 12.17% |
| South Korea | 9,897 | -6.91% |
From Jan. to June in 2013, global piano major import countries and regions were the United States, China, Germany, Japan, France, Canada, Australia, the United Kingdom, Switzerland and South Korea.
(Source: UN COMTRADE)
