USA Telecommunication & Broadcasting Industry Import from 2010 to 2012
| HS Code | Product Name |
| 8525 | Radio & TV transmitter, no matter with receiver, recorder, replayer or not; video camera, digital camera and video camcorder are hereinafter abbreviated as “Radio & TV Transmitter”. |
| 8526 | Radar, Radio Navigator & RC Equipment |
| 8527 | Radio receiver, no matter assembled with recorder, replayer, clock or not, are hereinafter abbreviated as “Radio Receiver”. |
USA Radio & TV Transmitter(HS:8525)Industry Import from 2010 to 2012
USA Radio & TV Transmitter Annual Import Value from 2010 to 2012
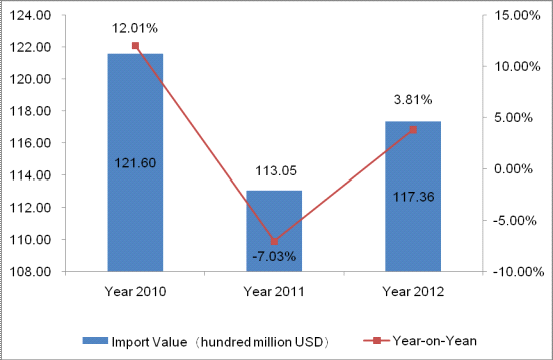
USA radio & TV transmitter import value from 2010 to 2012 was "V" shaped. The import value of these 3 years was 12.16 billion USD (increased 12.01% year on year), 11.305 billion USD (declined 7.03% year on year) and 11.736 billion USD (increased 3.81% year on year) respectively.
Major Countries/Regions for USA Radio & TV Transmitter Import from 2010 to 2012
| Countries/Regions | 2010 | 2011 | 2012 |
| China | 5,589,829 | 4,854,324 | 4,725,478 |
| Japan | 2,569,697 | 2,284,499 | 2,479,110 |
| Taiwan | 500,757 | 596,669 | 736,622 |
| Thailand | 531,729 | 659,470 | 669,179 |
| Canada | 664,596 | 616,413 | 605,626 |
| Malaysia | 520,355 | 460,340 | 550,081 |
| Mexico | 368,317 | 387,259 | 493,991 |
| Indonesia | 317,032 | 338,082 | 347,199 |
| South Korea | 186,466 | 205,452 | 228,092 |
| Germany | 142,882 | 175,732 | 196,690 |
| Singapore | 91,622 | 106,452 | 120,209 |
| United Kingdom | 64,258 | 72,410 | 68,365 |
| Israel | 76,900 | 61,985 | 56,908 |
| Philippines | 48,583 | 32,647 | 39,703 |
| Poland | 8,918 | 26,425 | 32,310 |
| France | 25,265 | 37,403 | 31,612 |
| Czech Republic | 1,972 | 7,818 | 29,658 |
| Ireland | 20,649 | 26,532 | 27,801 |
| Portugal | 24,935 | 30,099 | 27,051 |
| Hong Kong | 40,094 | 21,961 | 26,771 |
Proportion of Major Countries/Regions for USA Radio & TV Transmitter Import from 2010 to 2012
| Countries/Regions | 2010 | 2011 | 2012 |
| China↓ | 45.97% | 42.94% | 40.26% |
| Japan | 21.13% | 20.21% | 21.12% |
| Taiwan↑ | 4.12% | 5.28% | 6.28% |
| Thailand | 4.37% | 5.83% | 5.70% |
| Canada↓ | 5.47% | 5.45% | 5.16% |
| Malaysia | 4.28% | 4.07% | 4.69% |
| Mexico↑ | 3.03% | 3.43% | 4.21% |
| Indonesia | 2.61% | 2.99% | 2.96% |
| South Korea↑ | 1.53% | 1.82% | 1.94% |
| Germany↑ | 1.17% | 1.55% | 1.68% |
| Singapore↑ | 0.75% | 0.94% | 1.02% |
| United Kingdom | 0.53% | 0.64% | 0.58% |
| Israel↓ | 0.63% | 0.55% | 0.48% |
| Philippines | 0.40% | 0.29% | 0.34% |
| Poland↑ | 0.07% | 0.23% | 0.28% |
| France | 0.21% | 0.33% | 0.27% |
| Czech Republic↑ | 0.02% | 0.07% | 0.25% |
| Ireland↑ | 0.17% | 0.23% | 0.24% |
| Portugal | 0.21% | 0.27% | 0.23% |
| Hong Kong | 0.33% | 0.19% | 0.23% |
Note: ↑indicates the proportion of the country/region for USA radio & TV transmitter total import value from 2010 to 2012 continued to increase. ↓indicates the proportion of the country/region for USA radio & TV transmitter total import value from 2010 to 2012 continued to decline.
According to the proportion, from 2010 to 2012 the countries/regions continued to increase were Taiwan, Mexico, South Korea, Germany, Singapore, Poland, Czech Republic and Ireland; the countries/regions continued to decline were China, Canada and Israel.
USA Radar, Radio Navigator & RC Equipment(HS:8526)Industry Import from 2010 to 2012
USA Radar, Radio Navigator & RC Equipment Annual Import Value from 2010 to 2012
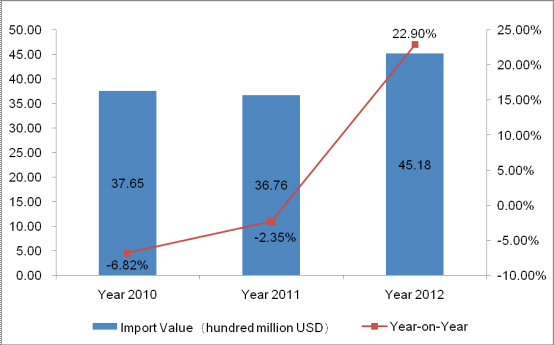
USA radar, radio navigator & RC equipment import value from 2010 to 2012 was "V" shaped. The import value of these 3 years was 3.765 billion USD (declined 6.82% year on year), 3.676 billion USD (declined 2.35% year on year) and 4.518 billion USD (increased 22.90% year on year) respectively.
Major Countries/Regions for USA Radar, Radio Navigator & RC Equipment Import from 2010 to 2012
| Countries/Regions | 2010 | 2011 | 2012 |
| Taiwan | 1,331,703 | 1,012,563 | 1,409,513 |
| China | 840,362 | 802,778 | 816,180 |
| Mexico | 404,076 | 555,498 | 704,113 |
| Japan | 519,584 | 484,285 | 537,760 |
| Canada | 173,051 | 195,404 | 241,159 |
| Germany | 93,846 | 128,366 | 194,268 |
| Malaysia | 53,169 | 68,032 | 119,158 |
| United Kingdom | 70,779 | 73,797 | 88,608 |
| South Korea | 61,636 | 74,543 | 60,614 |
| Indonesia | 27,989 | 31,162 | 40,037 |
| Portugal | 11,697 | 31,350 | 32,816 |
| Sweden | 17,121 | 19,377 | 32,118 |
| Thailand | 21,414 | 29,072 | 28,111 |
| Czech Republic | 3,368 | 15,531 | 25,047 |
| France | 20,006 | 23,515 | 24,244 |
| Hungary | 15,448 | 26,829 | 22,832 |
| Israel | 8,774 | 9,232 | 19,478 |
| Belgium | 4,462 | 10,125 | 14,170 |
| Italy | 8,658 | 10,808 | 12,858 |
| Norway | 9,443 | 20,200 | 12,378 |
Proportion of Major Countries/Regions for USA Radar, Radio Navigator & RC Equipment Import from 2010 to 2012
| Taiwan | 35.37% | 27.54% | 31.20% |
| China↓ | 22.32% | 21.84% | 18.07% |
| Mexico↑ | 10.73% | 15.11% | 15.58% |
| Japan↓ | 13.80% | 13.17% | 11.90% |
| Canada↑ | 4.60% | 5.32% | 5.34% |
| Germany↑ | 2.49% | 3.49% | 4.30% |
| Malaysia↑ | 1.41% | 1.85% | 2.64% |
| United Kingdom | 1.88% | 2.01% | 1.96% |
| South Korea | 1.64% | 2.03% | 1.34% |
| Indonesia↑ | 0.74% | 0.85% | 0.89% |
| Portugal | 0.31% | 0.85% | 0.73% |
| Sweden↑ | 0.45% | 0.53% | 0.71% |
| Thailand | 0.57% | 0.79% | 0.62% |
| Czech Republic↑ | 0.09% | 0.42% | 0.55% |
| France | 0.53% | 0.64% | 0.54% |
| Hungary | 0.41% | 0.73% | 0.51% |
| Israel↑ | 0.23% | 0.25% | 0.43% |
| Belgium↑ | 0.12% | 0.28% | 0.31% |
| Italy | 0.23% | 0.29% | 0.28% |
| Norway | 0.25% | 0.55% | 0.27% |
Note: ↑indicates the proportion of the country/region for USA radar, radio navigator & RC equipment total import value from 2010 to 2012 continued to increase. ↓indicates the proportion of the country/region for USA radar, radio navigator & RC equipment total import value from 2010 to 2012 continued to decline.
According to the proportion, from 2010 to 2012 the countries/regions continued to increase were Mexico, Canada, Germany, Malaysia, Indonesia, Sweden, Czech Republic, Israel and Belgium; the countries/regions continued to decline were China and Japan.
USA Radio Receiver(HS:8527)Industry Import from 2010 to 2012
USA Radio Receiver Annual Import Value from 2010 to 2012
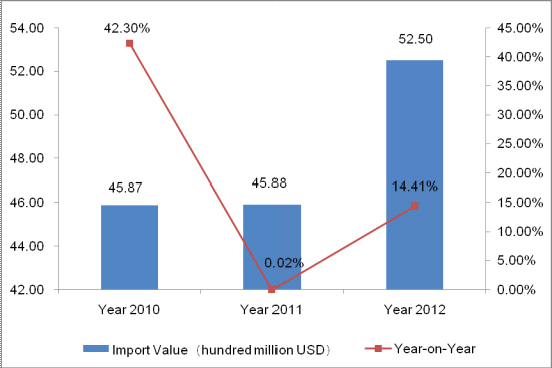
USA radio receiver import value from 2010 to 2012 increased year by year. The import value of these 3 years was 4.587 billion USD (increased 42.30% year on year), 4.588 billion USD (increased 0.02% year on year) and 5.250 billion USD (increased 14.41% year on year) respectively.
Major Countries/Regions for USA Radio Receiver Import from 2010 to 2012
(Unit: thousand USD)
| Countries/Regions | 2010 | 2011 | 2012 |
| China | 2,213,579 | 2,300,168 | 2,632,398 |
| Mexico | 768,525 | 786,220 | 1,026,127 |
| Thailand | 523,909 | 571,728 | 477,679 |
| Malaysia | 565,244 | 407,126 | 470,180 |
| Japan | 128,052 | 201,317 | 255,213 |
| South Korea | 40,530 | 78,164 | 147,422 |
| Indonesia | 147,481 | 122,162 | 110,416 |
| Czech Republic | 1,417 | 10,363 | 32,509 |
| Hong Kong | 36,531 | 14,337 | 25,320 |
| Hungary | 9,825 | 11,715 | 12,128 |
| Germany | 6,658 | 21,318 | 12,099 |
| Taiwan | 16,539 | 12,684 | 10,786 |
| Vietnam | 1,912 | 8,552 | 9,237 |
| Denmark | 5,220 | 2,212 | 8,737 |
| United Kingdom | 3,735 | 2,734 | 4,101 |
| Philippines | 32,360 | 12,912 | 3,787 |
| Canada | 9,524 | 5,915 | 2,842 |
| Portugal | 1,531 | 1,555 | 1,932 |
| Ireland | 37 | 58 | 1,738 |
| Australia | 379 | 1,027 | 1,437 |
Proportion of Major Countries/Regions for USA Radio Receiver Import from 2010 to 2012
| Countries/Regions | 2010 | 2011 | 2012 |
| China↑ | 48.25% | 50.13% | 50.15% |
| Mexico↑ | 16.75% | 17.14% | 19.55% |
| Thailand | 11.42% | 12.46% | 9.10% |
| Malaysia | 12.32% | 8.87% | 8.96% |
| Japan↑ | 2.79% | 4.39% | 4.86% |
| South Korea↑ | 0.88% | 1.70% | 2.81% |
| Indonesia↓ | 3.21% | 2.66% | 2.10% |
| Czech Republic↑ | 0.03% | 0.23% | 0.62% |
| Hong Kong | 0.80% | 0.31% | 0.48% |
| Hungary | 0.21% | 0.26% | 0.23% |
| Germany | 0.15% | 0.46% | 0.23% |
| Taiwan↓ | 0.36% | 0.28% | 0.21% |
| Vietnam | 0.04% | 0.19% | 0.18% |
| Denmark | 0.11% | 0.05% | 0.17% |
| United Kingdom | 0.08% | 0.06% | 0.08% |
| Philippines↓ | 0.71% | 0.28% | 0.07% |
| Canada↓ | 0.21% | 0.13% | 0.05% |
| Portugal | 0.03% | 0.03% | 0.04% |
| Ireland | / | / | 0.03% |
| Australia↑ | 0.01% | 0.02% | 0.03% |
Note: ↑indicates the proportion of the country/region for USA radio receiver total import value from 2010 to 2012 continued to increase. ↓indicates the proportion of the country/region for USA radio receiver total import value from 2010 to 2012 continued to decline.
According to the proportion, from 2010 to 2012 the countries/regions continued to increase were China, Mexico, Japan, South Korea, Czech Republic and Australia; the countries/regions continued to decline were Indonesia, Taiwan, Philippines and Canada.
(Source: UN COMTRADE)


