HS Code Product Name Description
| HS code | Product name | Abbreviation |
| 4011 | New pneumatic tyres, of rubber | New pneumatic tyres, of rubber |
| 8407 | Spark ignition reciprocating or rotary internal combustion piston engines | Spark ignition reciprocating or rotary internal combustion piston engines |
| 8409 | Parts suitable for use solely or principally with the engines of heading No.84.07 0r 84.08 | engines of heading No.84.07 0r 84.08 |
| 8711 | Motorcycles (including mopeds) and cycles fitted with an auxiliary motor, with or without sidecars; sidecars | Motorcycles and cycles fitted with an auxiliary motor |
| 8712 | Bicycles and other cycles (including delivery tricycles),not motorized | Bicycles and other not motorized cycles |
| 8714 | Parts and accessories of vehicles of headings No.87.11 to 87.13 | vehicles of headings No.87.11 to 87.13 |
| 9029 | Revolution counters, production counters, taximeters, mileometers, pedometers and the like; speed indicators and tachometers, other than those of heading No.90.14 or 90.15; stroboscopes | Revolution counters, taximeters, mileometers, etc. |
China Auto Parts & Accessories Exports, from Jan. to Dec. 2013
| Product Name | Unite | Volume | Value (USD) | Year-on-Year | |
| Volume | Value | ||||
| New pneumatic tyres, of rubber | Kg | 4,993,417,131 | 16,153,946,933 | 13.30% | 1.70% |
| Spark ignition reciprocating or rotary internal combustion piston engines | Kg | 11,425,891 | 5,822,726,391 | 3.70% | 5.70% |
| engines of headingNo.84.07 0r 84.08 | Kg | 1,008,997,580 | 5,159,975,281 | 1.20% | 15.30% |
| Motorcycles and cycles fitted with an auxiliary motor | Kg | 595,312,792 | 4,282,635,971 | -0.70% | 11.70% |
| Bicycles and other not motorized cycles | Kg | 57,402,375 | 3,189,162,173 | -0.40% | -0.20% |
| vehicles of headings No.87.11 to 87.13 | Set | 11,343,756 | 1,965,100,788 | 2.90% | 1.70% |
| Revolution counters, taximeters, mileometers, etc. | - | 99,614,911 | 1,044,357,747 | 15.80% | 29.50% |
China New Pneumatic Tyres, of Rubber (HS: 4011) Enterprises Distribution, from Jan. to Dec. 2013
| No. | Regions | Jan.- Dec. Total | Year-on-Year | ||
| Volume (Kg) | Value (USD) | Volume | Value | ||
| 1 | Shandong | 2,864,397,234 | 8,674,592,594 | 18.80% | 5.10% |
| 2 | Jiangsu | 400,871,728 | 1,594,646,352 | 3.80% | -2.30% |
| 3 | Zhejiang | 356,721,573 | 1,216,258,032 | 7.30% | -0.60% |
| 4 | Fujian | 198,956,955 | 738,982,973 | 10.30% | 0.10% |
| 5 | Guangdong | 180,434,322 | 602,440,408 | 0.90% | -7.90% |
| 6 | Henan | 193,453,333 | 598,832,639 | 6.40% | -3.90% |
| 7 | Tianjin | 148,433,159 | 516,570,819 | -1.60% | -7.40% |
| 8 | Shanghai | 141,686,477 | 491,534,492 | -1.50% | -11.50% |
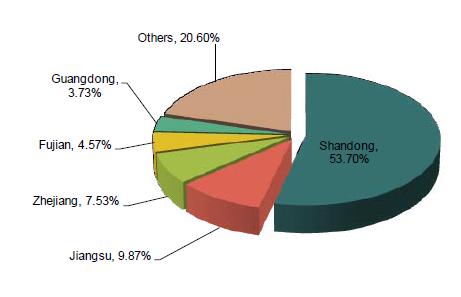
According to the export data statistics from Jan. to Dec. the major original places of export goods of China New Pneumatic Tyres, of Rubber are Shandong, Jiangsu and Zhejiang. The export value of Shandong accounted for more than 50% of China's total export value for this product.
China Spark Ignition Reciprocating or Rotary Internal Combustion Piston Engines (HS: 8407) Enterprises Distribution, from Jan. to Dec. 2013
| No. | Regions | Jan.- Dec. Total | Year-on-Year | ||
| Volume (Kg) | Value (USD) | Volume | Value | ||
| 1 | Chongqing | 6,288,757 | 646,675,569 | -1.40% | -4.50% |
| 2 | Shandong | 619,400 | 395,742,487 | 6.30% | -6.60% |
| 3 | Guangdong | 936,306 | 327,660,128 | 7.40% | 21.30% |
| 4 | Jiangsu | 1,707,660 | 308,542,501 | 9% | 8.60% |
| 5 | Zhejiang | 1,169,078 | 108,539,391 | 15.80% | 10% |
| 6 | Shanghai | 212,089 | 43,956,238 | -19.70% | -26.90% |
| 7 | Tianjin | 49,263 | 31,767,240 | -43.30% | 10.80% |
| 8 | Henan | 66,401 | 28,044,127 | 176.90% | 795.40% |
| 9 | Liaoning | 28,007 | 23,354,609 | 36.90% | 70.70% |
| 10 | Anhui | 53,966 | 14,010,062 | 13.10% | -52.90% |
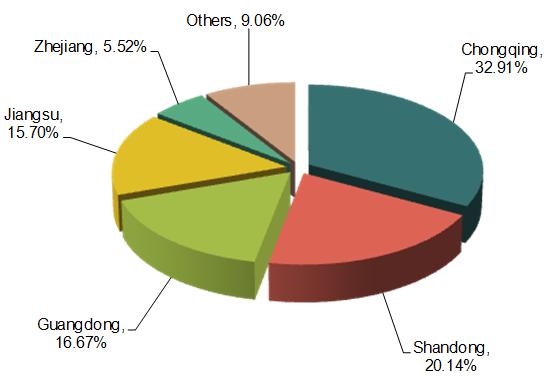
According to the export data statistics from Jan. to Dec. the major original places of export goods of Spark Ignition Reciprocating or Rotary Internal Combustion Piston Engines are Chongqing, Shandong and Guangdong. Among them the export value of Spark Ignition Reciprocating or Rotary Internal Combustion Piston Engines of Chongqing accounted for 32.91% of China's total export value for this product.
China Engines of Heading No.8407 0r 8408 (HS: 8409) Enterprises Distribution, from Jan. to Dec. 2013
| No. | Regions | Jan.- Dec. Total | Year-on-Year | ||
| Volume (Kg) | Value (USD) | Volume | Value | ||
| 1 | Guangdong | 68,628,878 | 846,599,088 | 13.20% | 62.40% |
| 2 | Jiangsu | 119,096,974 | 677,024,813 | -6.60% | 3.10% |
| 3 | Zhejiang | 55,067,471 | 503,215,735 | 4.70% | 7.50% |
| 4 | Shanghai | 41,516,913 | 451,496,269 | -8.90% | -3.50% |
| 5 | Shandong | 44,737,633 | 280,770,784 | 3.70% | 5.90% |
| 6 | Tianjin | 31,520,098 | 189,800,008 | 19.90% | 22.70% |
| 7 | Chongqing | 21,621,312 | 169,249,873 | -0.40% | 3.80% |
| 8 | Liaoning | 41,252,660 | 162,734,018 | -33% | -23.80% |
| 9 | Henan | 53,860,122 | 157,153,782 | 15.70% | 14.20% |
| 10 | Fujian | 18,965,495 | 131,913,782 | -8.40% | 0.30% |
According to the export data statistics from Jan. to Dec. the major original places of export goods of Engines of Heading No.84.07 0r 84.08 are Guangdong, Jiangsu and Zhejiang. The export value of Engines of Heading No.84.07 0r 84.08 of these three provinces accounted for 19.77%, 15.81% and 11.75% of China's total export value for this product. The major original places of export goods of Engines of Heading No.84.07 0r 84.08 are relatively disperse.
China Motorcycles and Cycles Fitted with an Auxiliary Motor (HS: 8711) Enterprises Distribution, from Jan. to Dec. 2013
| No. | Regions | Jan.- Dec. Total | Year-on-Year | ||
| Volume (Kg) | Value (USD) | Volume | Value | ||
| 1 | Guangdong | 3,908,139 | 2,007,433,634 | 11.20% | 10.30% |
| 2 | Chongqing | 3,312,990 | 1,618,067,846 | -1.40% | 2.60% |
| 3 | Zhejiang | 2,012,316 | 823,489,370 | 3.70% | 3.70% |
| 4 | Jiangsu | 929,457 | 535,942,392 | -9.30% | 5% |
| 5 | Tianjin | 305,701 | 229,575,893 | 18.40% | 8.90% |
| 6 | Shanghai | 271,645 | 222,954,839 | -15.90% | -16.40% |
| 7 | Henan | 235,495 | 102,649,965 | 10.60% | 14.90% |
| 8 | Fujian | 151,309 | 99,655,815 | -15.50% | -10% |
| 9 | Shandong | 102,176 | 78,045,743 | 23.40% | 24.20% |
| 10 | Hebei | 55,296 | 62,601,678 | 128.60% | 143.80% |
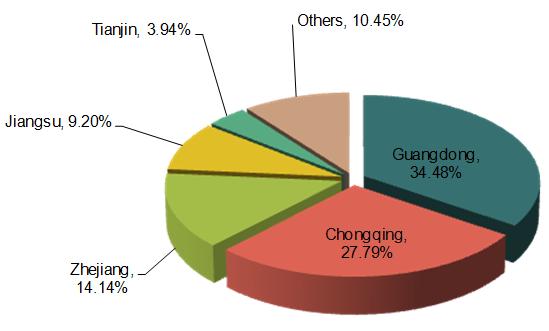
According to the export data statistics from Jan. to Dec. the major original places of export goods of Motorcycles and Cycles Fitted with An Auxiliary Motor are Guangdong, Chongqing and Zhejiang. Among them, the export value of Motorcycles and Cycles Fitted with An Auxiliary Motor of Guangdong and Chongqing accounted for 34.48% and 27.79% of China's total export value for this product.
China Bicycles and Other not Motorized Cycles (HS: 8712) Enterprises Distribution, from Jan. to Dec. 2013
| No. | Regions | Jan.- Dec. Total | Year-on-Year | ||
| Volume (Kg) | Value (USD) | Volume | Value | ||
| 1 | Tianjin | 19,009,481 | 1,069,845,149 | 4.50% | 8% |
| 2 | Jiangsu | 10,039,241 | 868,312,179 | -4.70% | -3.60% |
| 3 | Guangdong | 4,906,699 | 519,336,831 | -27.70% | -14.50% |
| 4 | Zhejiang | 16,545,271 | 502,264,364 | 1.50% | 3.90% |
| 5 | Hebei | 5,162,457 | 124,307,467 | 43.20% | 62% |
| 6 | Shanghai | 1,394,599 | 85,359,127 | -25.70% | -27.90% |
| 7 | Shandong | 71,277 | 6,314,801 | 0.80% | -21.30% |
| 8 | Xinjiang Uygur Autonomous Region | 121,028 | 5,291,198 | -0.90% | -2.70% |
| 9 | Chongqing | 17,821 | 1,484,690 | 275.60% | 1057.30% |
| 10 | Beijing | 39,619 | 1,437,425 | 167.70% | -11.30% |
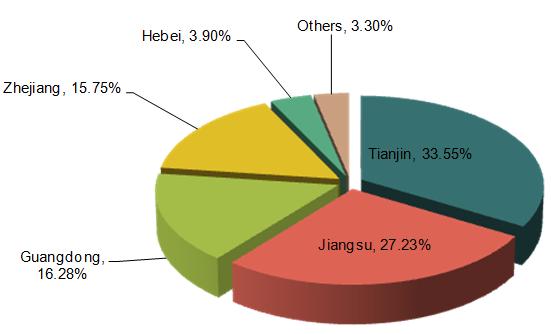
According to the export data statistics from Jan. to Dec. the major original places of export goods of Bicycles and Other not Motorized Cycles are Tianjin, Jiangsu and Guangdong. The export value of Bicycles and Other not Motorized Cycles of Tianjin and Jiangsu accounted for 34.48% and 27.79% of China's total export value for this product.
China Vehicles of Headings No.8711 to 8713 (HS: 8714) Enterprises Distribution, from Jan. to Dec. 2013
| No. | Regions | Jan.- Dec. Total | Year-on-Year | ||
| Volume (Kg) | Value (USD) | Volume | Value | ||
| 1 | Guangdong | 253,850,800 | 2,055,096,071 | 7.80% | 39.50% |
| 2 | Zhejiang | 295,854,796 | 1,070,153,787 | 5.90% | 7% |
| 3 | Jiangsu | 122,153,007 | 643,135,234 | -7.30% | 0.20% |
| 4 | Tianjin | 101,750,284 | 319,540,092 | -10.90% | -3.90% |
| 5 | Chongqing | 58,578,812 | 232,478,592 | 1.50% | -0.30% |
| 6 | Shanghai | 39,447,758 | 228,323,821 | -6.90% | -5.50% |
| 7 | Hebei | 80,094,132 | 199,218,441 | -0.90% | 14.60% |
| 8 | Fujian | 20,939,957 | 181,194,876 | -4.90% | -7.90% |
| 9 | Shandong | 11,212,033 | 79,747,595 | 1.40% | 15.10% |
| 10 | Hunan | 2,382,443 | 18,151,054 | 74.90% | 84.50% |
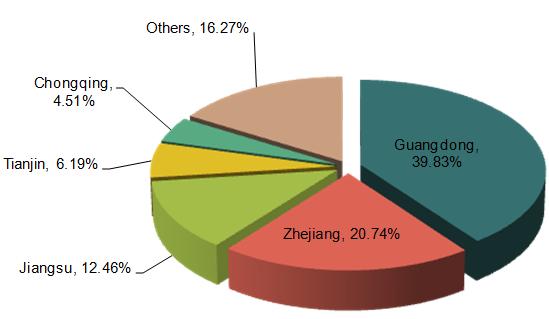
According to the export data statistics from Jan. to Dec. the major original places of export goods of Vehicles of Headings No.87.11 to 87.13 are Guangdong, Zhejiang and Jiangsu. The export value of Bicycles and Other not Motorized Cycles of Tianjin and Guangdong accounted for nearly forty percent of China's total export value for this product.
China Revolution Counters, Taximeters, Mileometers, etc. (HS: 9029) Enterprises Distribution, from Jan. to Dec. 2013
| No. | Regions | Jan.- Dec. Total | Year-on-Year | ||
| Volume (Kg) | Value (USD) | Volume | Value | ||
| 1 | Guangdong | 46,168,477 | 394,312,998 | 17.40% | 50.50% |
| 2 | Jiangsu | 10,194,509 | 361,829,814 | 84.80% | 44.80% |
| 3 | Shanghai | 8,938,662 | 125,679,827 | 20% | -12.90% |
| 4 | Anhui | 783,333 | 57,420,841 | 16.70% | 22% |
| 5 | Zhejiang | 25,351,187 | 45,273,769 | 4.50% | 12% |
| 6 | Tianjin | 245,701 | 18,144,259 | -20% | -23.40% |
| 7 | Liaoning | 1,092,531 | 7,996,530 | 20.50% | 11.40% |
| 8 | Shandong | 797,205 | 5,051,193 | 98.50% | 27.30% |
| 9 | Fujian | 2,211,222 | 4,569,325 | -24.70% | -34.50% |
| 10 | Chongqing | 538,094 | 4,527,373 | 16.40% | 15.90% |
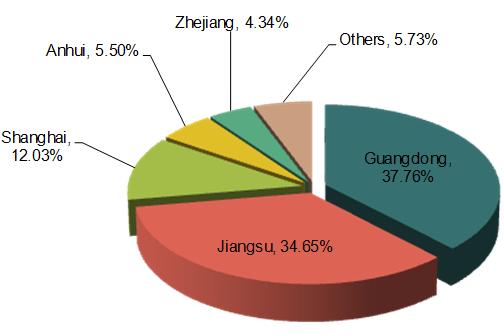
According to the export data statistics from Jan. to Dec. the major original places of export goods of Revolution Counters, Taximeters, Mileometers, etc. are Guangdong, Jiangsu and Shanghai. The export value of Revolution Counters, Taximeters, Mileometers, etc. of Guangdong and Jiangsu accounted for 37.76% and 34.65% of China's total export value for this product.
Source:China Customs


