Global Holiday Supplies (HS: 9505) Import and Export Trend Analysis from 2010 to 2012
Global Holiday Supplies Annual Total Imports Trend from 2010 to 2012
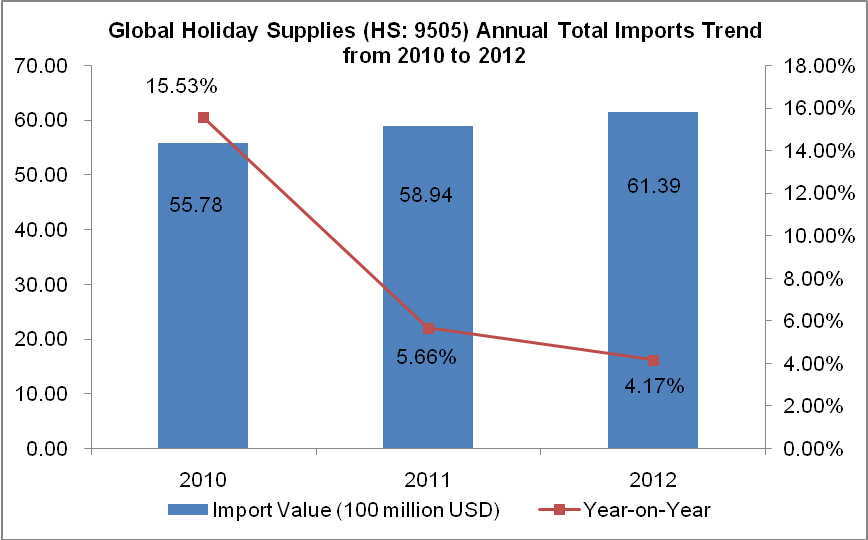
Global holiday supplies import value increased year by year from 2010 to 2012. The import value of 2012 amounted to 6.139 billion US dollars, with an increase of 4.17% year on year.
Global Holiday Supplies Main Demanding Countries/Regions Import Value from 2010 to 2012
| No. | Import Countries/Regions | Import Value (Thousand USD) | Growth Compared 2012 to 2010 | ||
|
|
| 2010 | 2011 | 2012 |
|
| 1 | USA | 2,631,998 | 2,736,057 | 2,829,036 | 7.49% |
| 2 | Canada | 306,997 | 346,959 | 367,887 | 19.83% |
| 3 | UK | 371,925 | 341,159 | 364,202 | -2.08% |
| 4 | Germany | 228,141 | 257,550 | 229,872 | 0.76% |
| 5 | France | 184,033 | 178,974 | 189,791 | 3.13% |
| 6 | Netherlands | 135,824 | 133,642 | 168,409 | 23.99% |
| 7 | The Russian Federation | 76,169 | 94,494 | 150,799 | 97.98% |
| 8 | Italy | 182,949 | 191,639 | 150,746 | -17.60% |
| 9 | Hong Kong | 159,691 | 152,345 | 144,949 | -9.23% |
| 10 | Belgium | 113,195 | 121,657 | 102,505 | -9.44% |
| 11 | Australia | 73,603 | 83,438 | 97,700 | 32.74% |
| 12 | Mexico | 80,516 | 83,732 | 88,209 | 9.55% |
| 13 | Brazil | 44,759 | 56,408 | 67,766 | 51.40% |
| 14 | Spain | 89,646 | 84,599 | 66,853 | -25.43% |
| 15 | Panama | 23,957 | 29,821 | 62,459 | 160.71% |
| 16 | Austria | 66,850 | 80,000 | 59,336 | -11.24% |
| 17 | Colombia | 33,603 | 42,975 | 51,932 | 54.55% |
| 18 | Japan | 36,272 | 41,744 | 47,738 | 31.61% |
| 19 | Chile | 32,722 | 41,945 | 46,530 | 42.20% |
| 20 | Switzerland | 41,385 | 44,691 | 43,181 | 4.34% |
The United States is the largest importing country of holiday supplies in the world. The import value of 2012 amounted to about 2.829 billion US dollars, with an increase of 7.49% compared to 2010. Canada and the United Kingdom ranked the second and the third separately, with import value of 368 million US dollars and 364 million US dollars in 2012. Among the above twenty import countries, the export value of Panama increased the largest, with an increase of 160.71% compared 2012 with 2010.
Global Holiday Supplies Main Demanding Countries/Regions Market Share from 2010 to 2012
| No. | Import Countries/Regions | Import Value Percentage | ||
|
|
| 2010 | 2011 | 2012 |
| 1 | USA↓ | 47.18% | 46.42% | 46.08% |
| 2 | Canada↑ | 5.50% | 5.89% | 5.99% |
| 3 | UK | 6.67% | 5.79% | 5.93% |
| 4 | Germany | 4.09% | 4.37% | 3.74% |
| 5 | France | 3.30% | 3.04% | 3.09% |
| 6 | Netherlands | 2.43% | 2.27% | 2.74% |
| 7 | The Russian Federation↑ | 1.37% | 1.60% | 2.46% |
| 8 | Italy↓ | 3.28% | 3.25% | 2.46% |
| 9 | Hong Kong↓ | 2.86% | 2.58% | 2.36% |
| 10 | Belgium | 2.03% | 2.06% | 1.67% |
| 11 | Australia↑ | 1.32% | 1.42% | 1.59% |
| 12 | Mexico | 1.44% | 1.42% | 1.44% |
| 13 | Brazil↑ | 0.80% | 0.96% | 1.10% |
| 14 | Spain↓ | 1.61% | 1.44% | 1.09% |
| 15 | Panama↑ | 0.43% | 0.51% | 1.02% |
| 16 | Austria | 1.20% | 1.36% | 0.97% |
| 17 | Colombia↑ | 0.60% | 0.73% | 0.85% |
| 18 | Japan↑ | 0.65% | 0.71% | 0.78% |
| 19 | Chile↑ | 0.59% | 0.71% | 0.76% |
| 20 | Switzerland | 0.74% | 0.76% | 0.70% |
Note: “↑”represents that the indicators listed continued to increase from 2010 to 2012, “↓”represents that the indicators listed continued to decrease from 2010 to 2012.
Judging from the three-year market share, the import value in proportion of Canada, the Russian Federation, Australia, Brazil, Panama, Colombia, Japan and Chile continued to rise, while that of the United States, Italy, Hong Kong and Spain continued to decline.
Global Holiday Supplies Main Exporting Countries/Regions Export Value from 2010 to 2012
| No. | Export Countries/Regions | Export Value (Thousand USD) | Growth Compared 2012 to 2010 | ||
| 2010 | 2011 | 2012 | |||
| 1 | China | 1,971,963 | 2,601,016 | 3,489,122 | 76.94% |
| 2 | Netherlands | 157,975 | 277,552 | 311,857 | 97.41% |
| 3 | Hong Kong | 311,523 | 285,602 | 271,011 | -13.00% |
| 4 | USA | 155,658 | 194,993 | 217,413 | 39.67% |
| 5 | Germany | 96,502 | 111,451 | 109,841 | 13.82% |
| 6 | Belgium | 100,188 | 96,989 | 94,138 | -6.04% |
| 7 | UK | 77,514 | 89,212 | 86,947 | 12.17% |
| 8 | Taiwan | 53,879 | 55,056 | 53,128 | -1.39% |
| 9 | Thailand | 49,817 | 50,818 | 50,620 | 1.61% |
| 10 | Italy | 56,236 | 52,550 | 49,346 | -12.25% |
| 11 | Mexico | 32,610 | 31,052 | 47,299 | 45.04% |
| 12 | Denmark | 31,454 | 36,321 | 36,478 | 15.97% |
| 13 | Poland | 31,239 | 34,258 | 33,670 | 7.78% |
| 14 | Canada | 19,835 | 26,691 | 27,828 | 40.30% |
| 15 | Austria | 23,262 | 37,854 | 27,204 | 16.95% |
| 16 | India | 11,776 | 17,442 | 25,156 | 113.62% |
| 17 | Spain | 34,272 | 30,813 | 24,846 | -27.50% |
| 18 | Philippines | 29,909 | 33,293 | 24,253 | -18.91% |
| 19 | The Russian Federation | 800 | 1,249 | 19,749 | 2368.63% |
| 20 | France | 19,442 | 18,195 | 19,136 | -1.57% |
China is the largest exporting country of holiday supplies in the world. The export value of 2012 accounted for 67.02% of the total export value of global holiday supplies. Among the above twenty exporting countries, the export value of the Russian Federation increased the largest, with an increase of 2368.63% compared 2012 with 2010.
Global Holiday Supplies Main Exporting Countries/Regions Market Share from 2010 to 2012
| No. | Export Countries/Regions | Export Value Percentage | ||
|
|
| 2010 | 2011 | 2012 |
| 1 | China↑ | 56.79% | 60.22% | 67.02% |
| 2 | Netherlands | 4.55% | 6.43% | 5.99% |
| 3 | Hong Kong↓ | 8.97% | 6.61% | 5.21% |
| 4 | USA | 4.48% | 4.51% | 4.18% |
| 5 | Germany↓ | 2.78% | 2.58% | 2.11% |
| 6 | Belgium↓ | 2.89% | 2.25% | 1.81% |
| 7 | UK↓ | 2.23% | 2.07% | 1.67% |
| 8 | Taiwan↓ | 1.55% | 1.27% | 1.02% |
| 9 | Thailand↓ | 1.43% | 1.18% | 0.97% |
| 10 | Italy↓ | 1.62% | 1.22% | 0.95% |
| 11 | Mexico | 0.94% | 0.72% | 0.91% |
| 12 | Denmark↓ | 0.91% | 0.84% | 0.70% |
| 13 | Poland↓ | 0.90% | 0.79% | 0.65% |
| 14 | Canada | 0.57% | 0.62% | 0.53% |
| 15 | Austria | 0.67% | 0.88% | 0.52% |
| 16 | India↑ | 0.34% | 0.40% | 0.48% |
| 17 | Spain↓ | 0.99% | 0.71% | 0.48% |
| 18 | Philippines↓ | 0.86% | 0.77% | 0.47% |
| 19 | The Russian Federation↑ | 0.02% | 0.03% | 0.38% |
| 20 | France↓ | 0.56% | 0.42% | 0.37% |
Note: “↑”represents that the indicators listed continued to increase from 2010 to 2012, “↓”represents that the indicators listed continued to decrease from 2010 to 2012.
Judging from the three-year market share, the export value in proportion of China, India and the Russian Federation continued to rise, while that of Hong Kong, Germany, Belgium, the United Kingdom, Taiwan, Thailand, Italy, Denmark, Poland, Spain, the Philippines and France continued to decline.


