China Piano Export Volume and Value from Jan. to October in 2013
| Month | Volume (Set) | Value (USD) | Compared to the Same Period of Last Year | |
|
|
|
| Volume | Value |
| January | 3,944 | 5,042,096 | -38% | -31.8% |
| February | 3,790 | 5,554,650 | 2% | 8% |
| March | 4,253 | 6,343,441 | 4% | -3% |
| April | 4,648 | 5,891,993 | 5.8% | -21.8% |
| May | 4,305 | 6,830,724 | -30% | -17.8% |
| June | 3,277 | 5,084,496 | -43.8% | -33.8% |
| July | 4,568 | 7,467,072 | -17.4% | 1.2% |
| August | 3,916 | 6,442,165 | -55% | -20.2% |
| September | 3,853 | 6,652,875 | -23.4% | -13.1% |
| October | 3,549 | 5,855,285 | -5.4% | -3.1% |
| Jan. to October Total | 40,103 | 61,164,797 | -25.1% | -14.8% |
The export volume of China piano from Jan. to October in 2013 amounted to 40100 sets, with a decrease of 25.1%, while the export value amounted to 61.165 million US dollars, with a decrease of 14.8%.
Among the first ten months of 2013, China's export value of piano rose slightly year on year only in February and July, and in the other eight months, the export value all decreased in different degrees.
China Piano Major Export Countries/Regions Distribution from Jan. to October in 2013
| No. | Countries | Volume (Set) | Value (USD) | Compared to the Same Period of Last Year | |
|
|
|
|
| Volume | Value |
| 1 | USA | 7,462 | 16,482,991 | -23.3% | -16.4% |
| 2 | Hong Kong | 3,514 | 7,052,852 | -17.1% | -13.9% |
| 3 | Germany | 4,226 | 6,351,659 | 3.8% | -3.5% |
| 4 | France | 1,845 | 2,009,045 | -19.2% | -24.5% |
| 5 | UK | 1,610 | 1,856,997 | -39.9% | -24.8% |
| 6 | Netherlands | 2,462 | 1,773,491 | 85.4% | -15.3% |
| 7 | Uzbekistan | 747 | 1,771,282 | 0 | 0 |
| 8 | Japan | 2,239 | 1,589,636 | 52.9% | -27% |
| 9 | Australia | 754 | 1,494,871 | -54.9% | -18.3% |
| 10 | Iran | 1,585 | 1,485,546 | 7% | -34.4% |
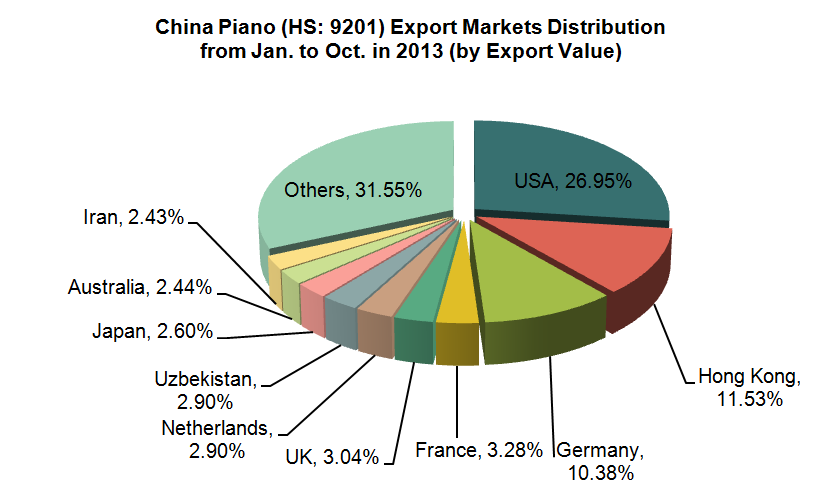
China's main export markets of piano were the United States, Hong Kong and Germany from Jan. to October in 2013. The export value to the three countries/regions accounted for 26.95%, 11.53% and 10.38% of our country's total export value of the product respectively and totally accounted for 48.86%.
China Piano Export Source Areas from Jan. to October in 2013
| No. | Regions | Volume (Set) | Value (USD) | Compared to the Same Period of Last Year | |
|
|
|
|
| Volume | Value |
| 1 | Guangdong | 15,122 | 25,497,615 | -22.5% | 7% |
| 2 | Zhejiang | 6,516 | 10,810,527 | -36.7% | -30.4% |
| 3 | Shanghai | 2,862 | 8,178,929 | -11.7% | 2% |
| 4 | Tianjin | 3,445 | 4,886,254 | -16.2% | -15.2% |
| 5 | Beijing | 2,390 | 2,843,709 | -32.4% | -36.2% |
| 6 | Shandong | 1,029 | 2,400,043 | -73.8% | -66.7% |
| 7 | Jiangsu | 5,099 | 2,336,089 | 433.9% | 74.7% |
| 8 | Hubei | 955 | 2,256,917 | -30.2% | -17.9% |
| 9 | Liaoning | 1,318 | 1,265,863 | -25.8% | -32.1% |
| 10 | Fujian | 996 | 346,256 | -71.2% | 24.8% |
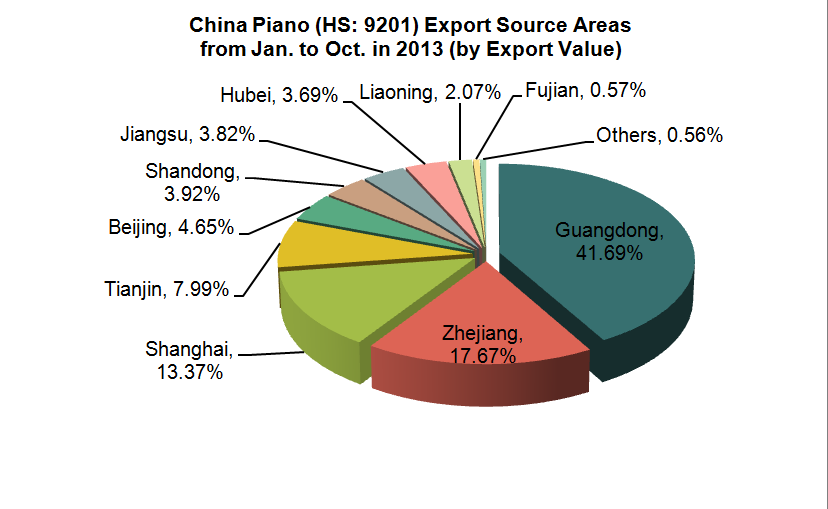
Guangdong, Zhejiang and Shanghai are our country's piano major export source areas. From Jan. to October in 2013, the export value of the above three areas totally accounted for 72.73% of the total export value of the product.
(Source: Customs Information Network)


