France Plastic Sanitary Ware (HS: 3922) Import Trend Analysis from 2010 to 2013
France Plastic Sanitary Ware Import Value Trend from 2010 to 2012
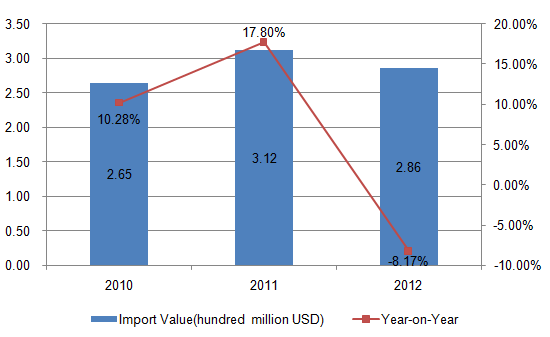
The total import value of France plastic sanitary ware from 2010 to 2012 showed an inverted "V" trend. And the total import value of the three years amounted to 254 million US dollars, 273 million US dollars and 246 million US dollars respectively, among of which, the import value of 2012 decreased by 9.99% year on year.
France Plastic Sanitary Ware Major Import Countries/Regions from 2010 to 2012
| No. | Import Countries/Regions | Import Value (Thousand USD) | Import Value Growth Compared 2012 to 2010 | ||
|
|
| 2010 | 2011 | 2012 |
|
| 1 | Germany | 60,393 | 67,700 | 61,260 | 1.44% |
| 2 | China | 45,514 | 49,640 | 44,677 | -1.84% |
| 3 | Italy | 31,432 | 28,441 | 25,245 | -19.68% |
| 4 | United Kingdom | 14,737 | 18,345 | 18,827 | 27.75% |
| 5 | Netherlands | 14,332 | 17,063 | 15,150 | 5.71% |
| 6 | Spain | 12,664 | 11,554 | 13,357 | 5.47% |
| 7 | Egypt | 10,982 | 12,299 | 11,258 | 2.51% |
| 8 | Belgium | 5,827 | 7,528 | 5,837 | 0.17% |
| 9 | Portugal | 5,457 | 6,915 | 5,627 | 3.12% |
| 10 | Sweden | 8,007 | 8,182 | 5,595 | -30.12% |
| 11 | Tunisia | 5,347 | 5,940 | 5,474 | 2.38% |
| 12 | Turkey | 3,221 | 3,165 | 4,811 | 49.36% |
| 13 | Poland | 7,155 | 5,998 | 4,622 | -35.40% |
| 14 | Bulgaria | 2,276 | 5,677 | 3,266 | 43.50% |
| 15 | Switzerland | 2,477 | 2,582 | 2,866 | 15.70% |
| 16 | India | 2,051 | 2,813 | 2,660 | 29.69% |
| 17 | Denmark | 2,688 | 3,133 | 2,591 | -3.61% |
| 18 | Czech | 1,196 | 1,517 | 1,833 | 53.26% |
| 19 | Hungary | 1,760 | 1,724 | 1,738 | -1.25% |
| 20 | Slovakia | 2,256 | 1,848 | 1,221 | -45.88% |
Germany, China and Italy are France's three largest plastic sanitary ware import countries from 2010 to 2012. Among France top twenty plastic sanitary ware import markets in 2012, Czech's import value of plastic sanitary ware increased by 53.26% compared to that of 2010, which was the largest increase, followed by Turkey, the import value of which increased by 49.36% compared to that of 2010.France Plastic Sanitary Ware Major Import Countries/Regions Market Share from 2010 to 2012
| No. | Import Countries/Regions | Import Value Percentage | ||
|
|
| 2010 | 2011 | 2012 |
| 1 | Germany↑ | 23.79% | 24.81% | 24.94% |
| 2 | China | 17.93% | 18.19% | 18.19% |
| 3 | Italy↓ | 12.38% | 10.42% | 10.28% |
| 4 | United Kingdom↑ | 5.81% | 6.72% | 7.66% |
| 5 | Netherlands | 5.65% | 6.25% | 6.17% |
| 6 | Spain | 4.99% | 4.23% | 5.44% |
| 7 | Egypt↑ | 4.33% | 4.51% | 4.58% |
| 8 | Belgium | 2.30% | 2.76% | 2.38% |
| 9 | Portugal | 2.15% | 2.53% | 2.29% |
| 10 | Sweden↓ | 3.15% | 3.00% | 2.28% |
| 11 | Tunisia↑ | 2.11% | 2.18% | 2.23% |
| 12 | Turkey | 1.27% | 1.16% | 1.96% |
| 13 | Poland↓ | 2.82% | 2.20% | 1.88% |
| 14 | Bulgaria | 0.90% | 2.08% | 1.33% |
| 15 | Switzerland | 0.98% | 0.95% | 1.17% |
| 16 | India↑ | 0.81% | 1.03% | 1.08% |
| 17 | Denmark | 1.06% | 1.15% | 1.05% |
| 18 | Czech↑ | 0.47% | 0.56% | 0.75% |
| 19 | Hungary | 0.69% | 0.63% | 0.71% |
| 20 | Slovakia↓ | 0.89% | 0.68% | 0.50% |
Note: “↑”represents that the indicators listed continued to increase from 2010 to 2012, “↓”represents that the indicators listed continued to decrease from 2010 to 2012.
Judging from the market share, the import value in proportion of Germany, the United Kingdom, Egypt, Tunisia, India and the Czech Republic continued to rise, while that of Italy, Sweden, Poland and Slovakia continued to decline from 2010 to 2012.
France Plastic Sanitary Ware Major Import Countries/Regions from Jan. to Aug. 2013
| Countries/Regions | Import Value of Jan.-August 2013 (thousand US dollars) | YOY | Percentage |
| Total | 172,826 | 1.31% | 100.00% |
| Germany | 46,947 | -0.63% | 27.16% |
| China | 26,333 | 1.88% | 15.24% |
| Italy | 16,353 | -4.27% | 9.46% |
| United Kingdom | 14,375 | 16.11% | 8.32% |
| Spain | 11,135 | 18.32% | 6.44% |
| Netherlands | 10,122 | -18.74% | 5.86% |
| Egypt | 9,630 | 19.49% | 5.57% |
| Belgium | 8,701 | 19.00% | 5.03% |
| Poland | 4,543 | 31.76% | 2.63% |
| Sweden | 4,113 | 15.70% | 2.38% |
From Jan. to Aug. 2013, France's import value of plastic sanitary ware amounted to 173 million US dollars, and the import value of Germany plastic sanitary ware amounted to 46.947 million US dollars, accounting for 27.16% of the total import value, followed by China, accounting for 15.24% of the total import value.


