Chinese Vacuum Cleaner(HS: 8508)Export Volume and Value from Jan. to May. in 2013
| Month | Volume(-) | Value (USD) | Year on Year | |
| Volume | Value | |||
| January | 12,165,817 | 285,522,062 | 7.9% | 15.3% |
| February | 8,070,684 | 198,429,452 | 11.6% | 16.6% |
| March | 10,634,812 | 252,811,289 | -4.5% | -0.5% |
| April | 10,804,027 | 253,640,180 | 3.6% | 8.6% |
| May | 11,364,726 | 264,257,698 | 2.2% | 1.9% |
| Total | 53,040,066 | 1,254,660,681 | 3.6% | 7.7% |
Chinese vacuum cleaners exports amounted to $ 1.255 billion from Jan. to May. in 2013, with an increase of 7.7% year on year.
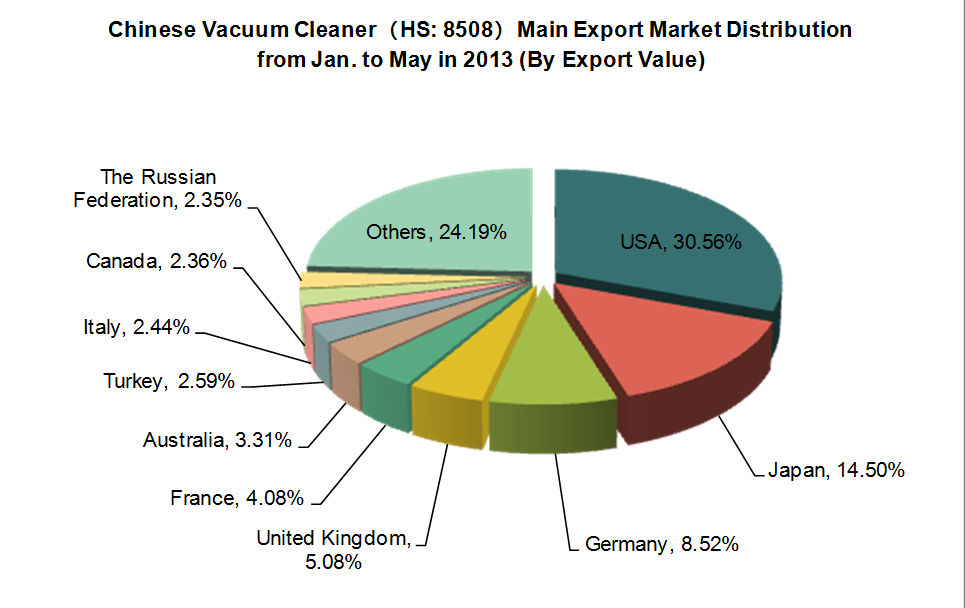
Major Export Countries / Regions for Chinese Vacuum Cleaner(HS: 8508) from Jan. to May. in 2013
| No. | Country | Volume(-) | Value (USD) | Year on Year | |
| Volume | Value | ||||
| 1 | USA | 13,825,041 | 383,436,265 | -1.4% | 12.9% |
| 2 | Japan | 5,279,029 | 181,946,128 | 15.4% | 15.4% |
| 3 | Germany | 4,251,364 | 106,902,531 | 9.5% | 6.4% |
| 4 | United Kingdom | 2,442,288 | 63,770,163 | -0.6% | 1.4% |
| 5 | France | 2,613,140 | 51,157,561 | 11.1% | 2.7% |
| 6 | Australia | 1,323,158 | 41,571,134 | 2.6% | 7.5% |
| 7 | Turkey | 1,883,552 | 32,500,260 | 50.4% | 32.5% |
| 8 | Italy | 1,535,857 | 30,637,068 | 1.6% | -5.7% |
| 9 | Canada | 1,387,400 | 29,657,931 | 5.2% | 8.5% |
| 10 | The Russian Federation | 934,191 | 29,529,314 | -1.7% | -1% |

Among the top ten export destination countries / regions, Turkey shows a large increase in export volume (increased by 50.4%); and also in export value (increased by32.5%) from Jan. to May. in 2013.
Export Source for Chinese Vacuum Cleaner(HS: 8508) from Jan. to May. in 2013
| No. | Region | Volume | Value(USD) | Year on Year | |
| Volume | Value | ||||
| 1 | Jiangsu | 24,474,754 | 577,017,464 | 19% | 18.4% |
| 2 | Guangdong | 14,018,686 | 416,665,656 | -5.2% | 1.2% |
| 3 | Zhejiang | 10,086,658 | 178,843,541 | -17.5% | -11.5% |
| 4 | Shanghai | 1,985,245 | 40,374,983 | 32.8% | 29.4% |
| 5 | Tianjin | 2,128,687 | 31,785,230 | 11.4% | 16.1% |
| 6 | Fujian | 122,842 | 2,904,230 | 27.7% | 14.5% |
| 7 | Liaoning | 50,693 | 2,695,986 | 207.9% | 204.9% |
| 8 | Anhui | 74,854 | 1,717,734 | 11877% | 31710% |
| 9 | Hunan | 41,531 | 1,292,561 | / | / |
| 10 | Shandong | 24,443 | 895,709 | 5.4% | -12.8% |
Jiangsu and Guangdong are our main export sources for vacuum cleaners. Vacuum cleaners export volume from the above two provinces accounted for 91.59% of total exports; export value of the products together accounted for 93.45% of total value from Jan. to May. 2013. Among the top 10 export sources, the largest increase of export volume and value are both in Anhui, increased by 11877% in volume and 31710% in value year on year.
(Source: China Customs network)


