The Export Situation of Instruments and Appliances for Surgery, Dentistry, Veterinary Sciences and Others in China.
The Export Volume and Sum of Instruments & Appliances for Surgery, Dentistry, Veterinary Sciences and Others (HS:901890) in Jan. – Aug., 2012 in China.
| Months | Volume(Unit) | Sum(one thousand dollar) | The month Volume compared with the same period of last year | The Sum compared with the same period of last year |
| Jan | 156,131,723 | 89,266.3 | 40.9% | -6.2% |
| Feb | 92,324,596 | 64,516.3 | 113.8% | 4.6% |
| Mar | 138,077,568 | 90,025.6 | 4.8% | 9.0% |
| Apr | 135,064,948 | 97,241.8 | 24.8% | 16.6% |
| May | 131,382,951 | 98,913.4 | 27.1% | 20.9% |
| Jun | 124,647,618 | 100,014.6 | 33.2% | 4.8% |
| Jul | 107,921,478 | 101,875.1 | 20.3% | 4.4% |
| Aug | 100,015,203 | 99,057.7 | 14.1% | -1.9% |
| Total | 985,566,085 | 740,910.9 | 28.3% | 6.0% |
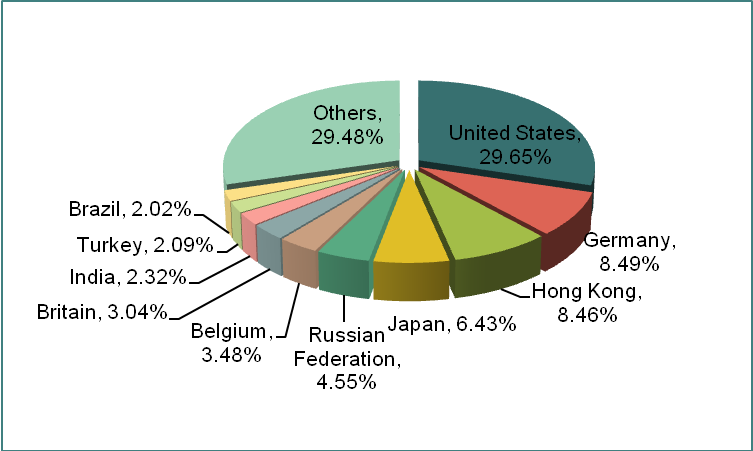
The Export Countries/Regions of Instruments & Appliances for Surgery, Dentistry, Veterinary Sciences and Others (HS;901890) in Jan. – Aug., 2012 in China (Ranked by sum of export).
| No. | Countries/Regions | Total in Jan. – Aug., 2012 | Over the same period of last year | ||
|
|
| Volume(Unit) | Sum(one thousand dollar) | Volume | Sum |
| 1 | USA | 236,570,387 | 219,655.5 | -9.1% | 8.4% |
| 2 | Germany | 71,591,169 | 62,879.7 | 33.7% | -0.7% |
| 3 | HK | 10,549,815 | 62,697.8 | 20.2% | -5.6% |
| 4 | Japan | 50,760,545 | 47,619.0 | 4.5% | 4.8% |
| 5 | Russia | 30,638,109 | 33,731.6 | 95.7% | 37.3% |
| 6 | Belgium | 3,261,777 | 25,788.4 | -58.6% | 6.3% |
| 7 | UK | 19,840,291 | 22,492.3 | -1.6% | 27.1% |
| 8 | India | 12,740,551 | 17,207.5 | 209.2% | 24.4% |
| 9 | Turkey | 119,177,835 | 15,460.2 | 240.2% | 2.9% |
| 10 | Brazil | 15,984,821 | 14,944.1 | 70.4% | 11.0% |
| 11 | France | 15,029,027 | 11,871.5 | -54.1% | 32.8% |
| 12 | Italy | 15,622,423 | 11,731.0 | 6.6% | -9.1% |
| 13 | Netherland | 20,588,117 | 11,560.5 | -6.6% | -38.6% |
| 14 | Australia | 25,438,106 | 10,304.3 | 77.5% | 13.0% |
| 15 | Costa Rica | 2,221,717 | 8,952.0 | -11.2% | 22.6% |
| 16 | Singapore | 1,674,875 | 8,401.7 | 88.6% | 3.6% |
| 17 | Venezuela | 13,154,740 | 8,141.2 | 182.1% | 50.2% |
| 18 | Indonesia | 8,353,520 | 6,964.8 | 339.9% | 14.5% |
| 19 | Iran | 1,345,088 | 5,993.8 | -86.9% | -10.8% |
| 20 | Canada | 45,688,148 | 5,509.6 | 237.4% | 39.3% |
The Custom Export Volume and Sum of Instruments & Appliances for Surgery, Dentistry, Veterinary Sciences and Others (HS:901890) in Jan. – Aug., 2012 in China (Ranked by sum of export).
| No. | Custom | Total in Jan. – Aug., 2012 | Over the same period of last year | ||
|
|
| Volume(Unit) | Sum(one thousand dollar) | Volume | Sum |
| 1 | Shanghai | 267,472,870 | 376,718.7 | -3.3% | 10.3% |
| 2 | Shenzhen | 21,073,877 | 138,217.2 | 5.0% | 15.9% |
| 3 | Tianjin | 50,081,463 | 48,770.6 | 1116.6% | 4.3% |
| 4 | Beijing | 1,591,039 | 31,928.9 | -68.1% | 0.3% |
| 5 | Ningbo | 56,416,313 | 29,407.5 | 79.2% | 15.2% |
| 6 | Huangpu | 25,055,897 | 27,422.4 | 72.0% | 42.2% |
| 7 | Nanjing | 48,677,089 | 26,230.9 | -2.8% | 14.4% |
| 8 | Qingdao | 11,944,301 | 14,858.5 | 48.8% | -6.3% |
| 9 | Dalian | 484,535,571 | 10,210.6 | 38.1% | -72.3% |
| 10 | Jiangmen | 892,332 | 8,265.1 | 65.1% | 16.8% |
The Export Original Production Bases of Instruments & Appliances for Surgery, Dentistry, Veterinary Sciences and Others (HS:901890) in Jan. – Aug., 2012 in China (Ranked by sum of export).
| No. | Regions | Total in Jan. – Aug., 2012 | Over the same period of last year | ||
|
|
| Volume(Unit) | Sum(one thousand dollar) | Volume | Sum |
| 1 | Guangdong | 44,019,186 | 183,412.8 | 27.5% | 16.6% |
| 2 | Shanghai | 33,622,883 | 169,919.4 | -25.4% | / |
| 3 | Jiangsu | 230,075,184 | 153,664.1 | -5.7% | 7.9% |
| 4 | Zhejiang | 81,249,265 | 100,738.9 | 51.9% | 39.4% |
| 5 | Beijing | 52,489,360 | 52,641.6 | 642.8% | 3.5% |
| 6 | Tianjin | 3,298,861 | 20,525.5 | -4.6% | -25.4% |
| 7 | Shandong | 10,959,383 | 15,275.0 | 18.1% | -7.8% |
| 8 | Liaoning | 484,421,910 | 10,919.1 | 38.1% | -70.6% |
| 9 | Anhui | 29,615,412 | 5,730.0 | 167.8% | 233.6% |
| 10 | Fujian | 3,069,774 | 5,696.7 | 253.7% | -11.4% |
The export volume of instruments & appliances (referred in surgery, dentistry, Veterinary Sciences and others) reaches 990 million units approximately from Jan. to Aug. 2012 in China, which is up 28.3% over the same period of last year. And also, the sum of export reaches $740 million at the period, achieved 6% up compared with last year.
The export countries focus on USA, Germany and HK. And the account of U.S exports takes 29.65% of the total amount of exports.
The export customs mainly are Shanghai, Shenzhen and Tianjin. Specially, the export volume from Tianjin custom has growth 1116.6% over the same period of last year.
The export original production bases mainly focus on Guangdong, Shanghai, Jiangsu and Zhejiang.
The Export Situation of Mechano-Therapy Appliances, Massage Apparatus and Psychological Aptitude-Testing Apparatus in China.
The Export Volume and Sum of Mechano-Therapy Appliances, Massage Apparatus and Psychological Aptitude-Testing Apparatus (HS:901910) in Jan. – Aug., 2012 in China.
| Month | Volume(Unit) | Sum(one thousand dollar) | The month Volume compared with the same period of last | The month Sum compared with the same period of last |
| Jan | 6,418,146 | 110,426.0 | 3.1% | 8.2% |
| Feb | 3,134,269 | 60,315.4 | 4.2% | 13.8% |
| Mar | 5,937,519 | 112,738.0 | -6.4% | 17.1% |
| Apr | 6,765,120 | 123,339.9 | 7.8% | 10.4% |
| May | 6,610,874 | 130,667.1 | -4.1% | 17.8% |
| Jun | 6,767,385 | 122,537.8 | 5.2% | 6.0% |
| Jul | 7,077,094 | 125,729.4 | -17.7% | / |
| Aug | 9,525,129 | 134,245.8 | 1.8% | / |
| Total | 52,235,536 | 919,999.5 | -1.7% | 8.3% |
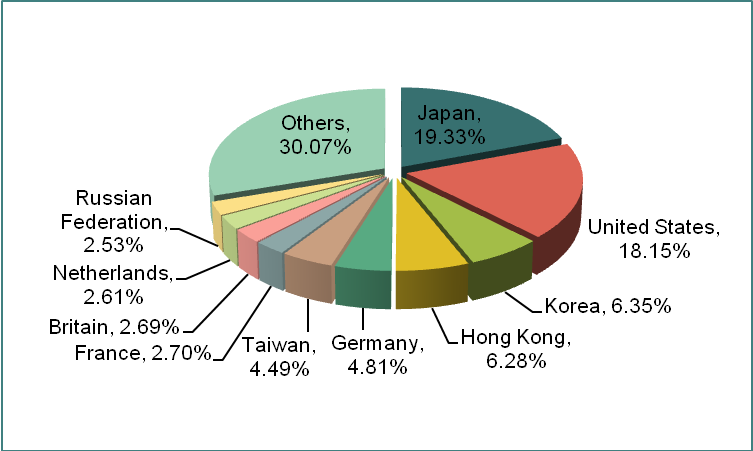
The Export Countries/Regions of Mechano-Therapy Appliances, Massage Apparatus and Psychological Aptitude-Testing Apparatus (HS:901910) in Jan. – Aug., 2012 in China (Ranked by sum of export).
| No. | Countries/ Regions | Total in Jan.–Aug.,2012 | Over compared with the same period of last year | ||
|
|
| Volume(Unit) | Sum(One thousand dollar) | Volume | Sum |
| 1 | Japan | 5,505,126 | 177,848.0 | -18.1% | 0.4% |
| 2 | USA | 12,867,976 | 166,981.7 | 2.7% | 21.5% |
| 3 | Korea | 846,897 | 58,410.2 | 98.2% | 43.0% |
| 4 | HK | 10,085,862 | 57,802.9 | -1.0% | 34.1% |
| 5 | Germany | 3,627,438 | 44,214.8 | 3.8% | -6.1% |
| 6 | Chinese Taipei | 905,397 | 41,273.6 | 8.7% | 16.2% |
| 7 | France | 909,942 | 24,838.6 | -10.4% | 21.1% |
| 8 | United Kingdom | 1,520,096 | 24,789.3 | 12.5% | 8.8% |
| 9 | Netherland | 1,225,537 | 23,974.1 | -27.4% | -3.4% |
| 10 | Russia | 1,745,072 | 23,255.2 | 67.5% | 38.1% |
| 11 | Malaysia | 476,250 | 21,887.2 | -21.3% | 0.7% |
| 12 | Singapore | 353,758 | 19,856.8 | 29.6% | 30.5% |
| 13 | Australia | 655,259 | 17,298.8 | 49.2% | 11.8% |
| 14 | Canada | 617,249 | 15,624.2 | -20.5% | 17.6% |
| 15 | Span | 812,608 | 15,322.6 | 2.0% | -18.4% |
| 16 | Brazil | 1,293,568 | 13,196.2 | 26.1% | 25.2% |
| 17 | Italy | 901,328 | 10,370.5 | -7.2% | -37.1% |
| 18 | Saudi Arabia | 159,427 | 9,526.4 | -6.1% | 37.8% |
| 19 | Sweden | 339,205 | 8,452.1 | -41.9% | -2.0% |
| 20 | India | 216,396 | 8,438.0 | 31.2% | 9.5% |
The Custom Export Volume and Sum of Mechano-Therapy Appliances, Massage Apparatus and Psychological Aptitude-Testing Apparatus (HS:901910) in Jan.–Aug., 2012 in China (Ranked by sum of export).
| No. | Custom | Total in Jan.–Aug.,2012 | Over compared with the same period of last year | ||
|
|
| Volume(Unit) | Sum(one thousand dollar) | Volume | Sum |
| 1 | Shanghai | 4,867,526 | 306,544.3 | -16.6% | 16.6% |
| 2 | Shenzhen | 18,134,008 | 152,282.1 | 14.4% | 20.8% |
| 3 | Xiamen | 5,504,357 | 139,077.5 | -14.6% | -7.0% |
| 4 | Ningbo | 14,343,834 | 126,024.2 | 5.9% | -1.3% |
| 5 | Huangpu | 4,940,284 | 66,736.2 | -39.0% | -0.4% |
| 6 | Guangzhou | 560,850 | 41,646.0 | -40.2% | 0.0% |
| 7 | Fuzhou | 226,430 | 19,652.6 | 44.0% | 46.0% |
| 8 | Qingdao | 341,687 | 16,180.1 | 63.2% | -3.4% |
| 9 | Nanjing | 693,602 | 13,546.0 | 1218.0% | 177.9% |
| 10 | Hangzhou | 324,137 | 12,309.0 | -14.9% | -35.1% |
The Export Original Production Bases of Mechano-Therapy Appliances, Massage Apparatus and Psychological Aptitude-Testing Apparatus (HS:901910) in Jan.–Aug., 2012 in China (Ranked by sum of export).
| No. | Regions | Total in Jan.–Aug.,2012 | Over compared with the same period of last year | ||
|
|
| Volume(Unit) | Sum(one thousand dollar) | Volume | Sum |
| 1 | Guangdong | 24,946,352 | 273,518.0 | -2.2% | 10.4% |
| 2 | Zhejiang | 16,551,703 | 209,034.6 | 3.0% | 3.8% |
| 3 | Fujian | 5,710,966 | 159,239.3 | -13.9% | -3.0% |
| 4 | Jiangsu | 2,317,087 | 122,161.7 | 0.4% | 12.8% |
| 5 | Shanghai | 1,026,087 | 97,536.0 | -17.8% | 12.9% |
| 6 | Anhui | 148,866 | 27,757.4 | 7.8% | 56.6% |
| 7 | Shandong | 346,490 | 16,097.5 | 100.6% | -2.0% |
| 8 | Hebei | 246,628 | 5,496.0 | 188.5% | 300.8% |
| 9 | Tianjin | 150,724 | 3,544.6 | 76.4% | 88.0% |
| 10 | Liaoning | 659,833 | 3,451.2 | -13.4% | 0.5% |
The export volume of Mechano-Therapy Appliances, Massage Apparatus and Psychological Aptitude-Testing Apparatus, reaches 50 million units approximately from Jan.–Aug. 2012 in China, which is down 28.3% over the same period of last year. And also, the sum of export reaches $920 million at the period, achieved 8.3% up compared with last year.
The export countries mainly focus on USA, Korea and Japan. Meanwhile, the account of Japan exports takes 19.33% of the total amount of exports, and the account of U.S exports hold 18.15% of the total.
The export customs mainly are Shanghai, Shenzhen and Xiamen. With a huge increase, the export volume at Nanjing custom is up 1218.0% over the same period of last year, and the export amount of growth is 177.9%.
The export original production bases mainly focus on Guangdong and Zhejiang. At the top ten export original production bases, the export volume based on Hebei is up 188.5% over the same period of last year, and the export amount of growth is 300.8%.


