2011-2013 Global Festive Supplies Import Trend Analysis
2011-2013 Global Festive Supplies Import Value Trend
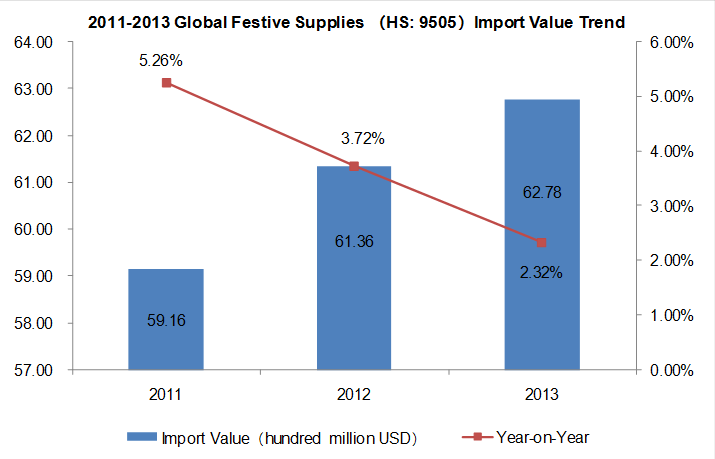
From 2011 to 2013, the global import value of festive supplies showed an increasing trend year by year. The three year’s total import value was respectively 5.916 billion dollars, 6.136 billion dollars and 6.278 billion dollars. Among them, the import value of 2013 increased 2.32%, compared to the same period of the year 2012.
2011-2013 Global Festive Supplies Mainly Import Countries / Regions
| No. | Countries / Regions | Import Value (Thousand Dollars) | Exports in 2013 compared with exports in 2011 | ||
| 2011 | 2012 | 2013 | |||
| 1 | USA | 2,736,057 | 2,829,036 | 2,897,007 | 5.88% |
| 2 | United Kingdom | 369,712 | 364,202 | 401,214 | 8.52% |
| 3 | Canada | 346,959 | 367,887 | 396,207 | 14.19% |
| 4 | Germany | 257,550 | 229,872 | 222,987 | -13.42% |
| 5 | France | 178,974 | 189,791 | 181,916 | 1.64% |
| 6 | Netherlands | 139,347 | 170,045 | 162,714 | 16.77% |
| 7 | Italy | 191,470 | 149,694 | 145,977 | -23.76% |
| 8 | Russian Federation | 94,494 | 149,460 | 125,464 | 32.77% |
| 9 | Australia | 83,438 | 97,700 | 109,950 | 31.77% |
| 10 | Belgium | 121,929 | 102,505 | 109,232 | -10.41% |
| 11 | Mexico | 83,732 | 88,209 | 94,432 | 12.78% |
| 12 | Iran | 1,698 | 13,250 | 71,953 | 4137.51% |
| 13 | Hong Kong | 152,345 | 144,949 | 67,899 | -55.43% |
| 14 | Brazil | 56,408 | 67,766 | 64,151 | 13.73% |
| 15 | Spanish | 84,599 | 66,853 | 63,328 | -25.14% |
| 16 | Chile | 41,944 | 46,530 | 62,065 | 47.97% |
| 17 | Austria | 79,389 | 59,173 | 58,362 | -26.49% |
| 18 | Japan | 41,744 | 47,738 | 55,421 | 32.76% |
| 19 | Panama | 29,821 | 62,561 | 52,889 | 77.35% |
| 20 | Ireland | 43,494 | 47,922 | 49,502 | 13.81% |
From 2011 to 2013, USA, United Kingdom and Canada were the top three import countries of global festive supplies. Among the top 20 global import market of festive supplies in 2013, the import value of Iran increased 4137.51%, compared to the year 2011.
2011-2013 Global Festive Supplies Mainly Import Countries / Regions Market Share
| No. | Countries / Regions | Import Value Percentage | ||
| 2011 | 2012 | 2013 | ||
| 1 | USA | 46.25% | 46.11% | 46.14% |
| 2 | United Kingdom | 6.25% | 5.94% | 6.39% |
| 3 | Canada↑ | 5.86% | 6.00% | 6.31% |
| 4 | Germany↓ | 4.35% | 3.75% | 3.55% |
| 5 | France | 3.03% | 3.09% | 2.90% |
| 6 | Netherlands | 2.36% | 2.77% | 2.59% |
| 7 | Italy↓ | 3.24% | 2.44% | 2.33% |
| 8 | Russian Federation | 1.60% | 2.44% | 2.00% |
| 9 | Australia↑ | 1.41% | 1.59% | 1.75% |
| 10 | Belgium | 2.06% | 1.67% | 1.74% |
| 11 | Mexico↑ | 1.42% | 1.44% | 1.50% |
| 12 | Iran↑ | 0.03% | 0.22% | 1.15% |
| 13 | Hong Kong↓ | 2.58% | 2.36% | 1.08% |
| 14 | Brazil | 0.95% | 1.10% | 1.02% |
| 15 | Spanish↓ | 1.43% | 1.09% | 1.01% |
| 16 | Chile↑ | 0.71% | 0.76% | 0.99% |
| 17 | Austria↓ | 1.34% | 0.96% | 0.93% |
| 18 | Japan↑ | 0.71% | 0.78% | 0.88% |
| 19 | Panama | 0.50% | 1.02% | 0.84% |
| 20 | Ireland↑ | 0.74% | 0.78% | 0.79% |
Note: "↑"represents that the indicators listed continued to increase from 2011 to 2013, "↓"represents that the indicators listed continued to decrease from 2011 to 2013.
Judging from the market share, the countries whose market share continued to grow were Canada, Australia, Mexico, Iran, Chile, Japan and Ireland. While, the countries whose market share dropped continuously were Germany, Italy, Hong Kong, Spanish and Austria.
2011-2013 Global Festive Supplies Export Trend Analysis
2011-2013 Global Festive Supplies Mainly Export Countries / Regions
| No. | Countries / Regions | Export Value (Thousand Dollars) | Exports in 2013 compared with exports in 2011 | ||
| 2011 | 2012 | 2013 | |||
| 1 | China | 2,601,016 | 3,488,733 | 3,676,906 | 41.36% |
| 2 | Netherlands | 256,662 | 232,437 | 244,554 | -4.72% |
| 3 | USA | 194,993 | 217,413 | 218,567 | 12.09% |
| 4 | United Kingdom | 89,574 | 86,947 | 96,792 | 8.06% |
| 5 | Germany | 111,451 | 109,841 | 94,870 | -14.88% |
| 6 | Belgium | 96,380 | 94,138 | 93,933 | -2.54% |
| 7 | Thailand | 50,818 | 50,620 | 53,532 | 5.34% |
| 8 | Italy | 52,249 | 49,164 | 49,643 | -4.99% |
| 9 | Taiwan | 55,056 | 53,117 | 46,667 | -15.24% |
| 10 | Canada | 26,691 | 27,828 | 43,259 | 62.07% |
| 11 | Hong Kong | 285,602 | 271,011 | 39,740 | -86.09% |
| 12 | Poland | 34,258 | 33,670 | 38,511 | 12.41% |
| 13 | Mexico | 31,052 | 47,299 | 35,786 | 15.25% |
| 14 | Denmark | 36,128 | 35,104 | 35,322 | -2.23% |
| 15 | India | 17,442 | 25,156 | 34,434 | 97.42% |
| 16 | Austria | 37,763 | 26,802 | 32,187 | -14.77% |
| 17 | Spanish | 30,813 | 24,846 | 26,974 | -12.46% |
| 18 | France | 18,195 | 19,136 | 23,001 | 26.41% |
| 19 | Viet Nam | 7,962 | 10,532 | 19,019 | 138.87% |
| 20 | Sweden | 13,936 | 15,432 | 17,779 | 27.58% |
In 2013, the global top three export markets of festive supplies were China, Netherlands and USA. Among the global top 20 export market of festive supplies, the export value of Viet Nam showed the largest increase of 138.87%, compared to the same period of 2011. Followed by India, the export value increased 97.42%, compared to the year 2011.
2011-2013 Global Festive Supplies Mainly Export Countries / Regions Market Share
| No. | Countries / Regions | Export Value Percentage | ||
| 2011 | 2012 | 2013 | ||
| 1 | China↑ | 60.57% | 68.10% | 71.93% |
| 2 | Netherlands | 5.98% | 4.54% | 4.78% |
| 3 | USA | 4.54% | 4.24% | 4.28% |
| 4 | United Kingdom | 2.09% | 1.70% | 1.89% |
| 5 | Germany↓ | 2.60% | 2.14% | 1.86% |
| 6 | Belgium | 2.24% | 1.84% | 1.84% |
| 7 | Thailand | 1.18% | 0.99% | 1.05% |
| 8 | Italy | 1.22% | 0.96% | 0.97% |
| 9 | Taiwan↓ | 1.28% | 1.04% | 0.91% |
| 10 | Canada | 0.62% | 0.54% | 0.85% |
| 11 | Hong Kong↓ | 6.65% | 5.29% | 0.78% |
| 12 | Poland | 0.80% | 0.66% | 0.75% |
| 13 | Mexico | 0.72% | 0.92% | 0.70% |
| 14 | Denmark | 0.84% | 0.69% | 0.69% |
| 15 | India↑ | 0.41% | 0.49% | 0.67% |
| 16 | Austria | 0.88% | 0.52% | 0.63% |
| 17 | Spanish | 0.72% | 0.49% | 0.53% |
| 18 | France | 0.42% | 0.37% | 0.45% |
| 19 | Viet Nam↑ | 0.19% | 0.21% | 0.37% |
| 20 | Sweden | 0.32% | 0.30% | 0.35% |
Note: "↑"represents that the indicators listed continued to increase from 2011 to 2013, "↓"represents that the indicators listed continued to decrease from 2011 to 2013.
Judging from the market share, the countries whose market share continued to grow were China, India and Viet Nam. While, the countries whose market share dropped continuously were Germany, Taiwan and Hong Kong.


