Export Volume & Value of China's Baths, Shower-Baths and Wash Basins
| Month | Volume(kg) | Value(USD) | Y-o-Y | |
| Volume | Value | |||
| Jan | 7,691,431 | 33,175,354 | -1.30% | -0.50% |
| Feb | 6,507,300 | 26,687,648 | 115.70% | 141.10% |
| Mar | 3,018,687 | 12,099,395 | -44.80% | -39.10% |
| Apr | 6,855,268 | 25,969,842 | -13.20% | -6.50% |
| May | 7,415,027 | 31,309,984 | -8.90% | 9% |
| Jun | 6,941,682 | 28,883,223 | -6.40% | 2.20% |
| Jul | 7,069,857 | 29,713,256 | -5.50% | -0.80% |
| Aug | 7,011,256 | 29,222,954 | -10.60% | -1% |
| Sep | 6,848,731 | 30,481,160 | -8.70% | 3.10% |
| Oct | 6,389,752 | 26,575,623 | -3% | 4.20% |
| Nov | 6,219,617 | 30,464,537 | -11.50% | 9.30% |
| Dec | 8,357,566 | 34,276,874 | 10% | -1.10% |
| Total | 80,326,174 | 338,859,850 | -4.10% | 3.90% |
From January to December, China's baths, shower-baths and wash basins export volume reached 80300 tons, falling 4.1%. And export value reached USD 339 million, increasing by 3.9%.
Major Countries for China's Baths, Shower-Baths and Wash Basins Export
| No. | Country | Volume(kg) | Value(USD) | Y-o-Y | |
| Volume | Value | ||||
| 1 | The United States | 8,440,978 | 48,729,590 | -2.60% | 30.10% |
| 2 | The United Kingdom | 9,849,116 | 40,275,779 | 15.10% | 13.70% |
| 3 | Australia | 8,271,506 | 33,636,973 | 8.70% | 16.80% |
| 4 | Canada | 4,759,219 | 20,484,830 | 19.30% | 24.30% |
| 5 | Japan | 2,126,093 | 12,138,962 | -8.90% | -8.60% |
| 6 | France | 4,023,930 | 11,846,242 | -20.90% | -16.20% |
| 7 | Germany | 1,931,630 | 9,479,344 | 34.90% | 69.30% |
| 8 | New Zealand | 1,993,992 | 7,847,392 | 23.30% | 20.30% |
| 9 | Belgium | 1,964,832 | 7,015,421 | -13.40% | -7.30% |
| 10 | United Arab Emirates | 1,498,003 | 6,732,076 | -20% | -14.30% |
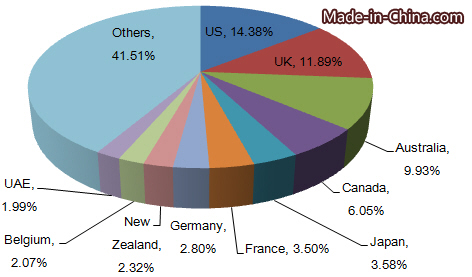
From January to December in 2015, the top three markets for China's basins export were US, UK and Australia. In the top 10 markets, China's exports to Germany grew fastest in 2015, up 69.3% on year.
China's Export Origins of Baths, Shower-Baths and Wash Basins
| No. | Province | Volume(kg) | Value(USD) | Y-o-Y | |
| Volume | Value | ||||
| 1 | Guangdong | 20,888,535 | 123,036,624 | 0.90% | 7.80% |
| 2 | Zhejiang | 28,042,229 | 121,624,278 | 9.10% | 20% |
| 3 | Shanghai | 15,232,392 | 50,745,344 | -10.40% | -7.70% |
| 4 | Anhui | 8,816,274 | 16,308,452 | -19.90% | -16.40% |
| 5 | Jiangsu | 3,927,621 | 12,579,081 | 28.30% | 33.30% |
| 6 | Fujian | 1,207,595 | 5,605,251 | -17.20% | -25.30% |
| 7 | Hebei | 434,708 | 1,735,496 | -24.30% | -24.10% |
| 8 | Shandong | 557,985 | 1,706,376 | -7.30% | -7.70% |
| 9 | Chongqing | 61,765 | 1,344,621 | 31.10% | 58.50% |
| 10 | Xinjiang | 232,404 | 898,639 | -90% | -90.10% |
Guangdong, Zhejiang and Shanghai were China's major export origins. From January to December in 2015, baths, shower-baths and wash basins from the three provinces accounted for 36.31% of China's total.


