China Collections (HS: 97) Export Volume and Value from Jan. to June in 2013
| Month | Volume (-) | Value (USD) | Compared to the Same Period of Last Year | |
|
|
|
| Volume | Value |
| January | 1,321,118 | 77,178,976 | 27.5% | 244.8% |
| February | 1,049,592 | 42,805,173 | 152.2% | 41.6% |
| March | 797,389 | 78,270,951 | -39.5% | 152.3% |
| April | 845,055 | 47,985,599 | -41.4% | 18% |
| May | 922,239 | 34,950,324 | -35.2% | -46% |
| June | 960,309 | 57,817,520 | -18.8% | 48.9% |
| Jan.-June Total | 5,895,702 | 339,008,543 | -13.5% | 48.8% |
The export value of China collections amounted to 339 million US dollars, with an increase of 48.8% from Jan. to June in 2013.
China Collections (HS: 97) Export Countries/Regions Distribution from Jan. to June in 2013
| No. | Countries | Volume (-) | Value (USD) | Compared to the Same Period of Last Year | |
|
|
|
|
| Volume | Value |
| 1 | Japan | 49,249 | 213,262,930 | 153.9% | 77.3% |
| 2 | USA | 1,453,273 | 41,114,258 | -5.4% | -16.4% |
| 3 | Hong Kong | 435,084 | 10,303,393 | 131.6% | 227.7% |
| 4 | Netherlands | 315,153 | 8,709,227 | 46.2% | 28.3% |
| 5 | Canada | 225,157 | 7,957,129 | -22.6% | -2% |
| 6 | UK | 359,323 | 6,483,045 | 16.7% | 60.6% |
| 7 | Germany | 231,528 | 5,963,418 | -43.3% | 40.4% |
| 8 | France | 357,267 | 4,311,936 | 17% | -18.1% |
| 9 | Australia | 163,422 | 4,144,235 | 14.4% | 41.7% |
| 10 | India | 54,510 | 3,342,090 | -1.8% | 1061.1% |
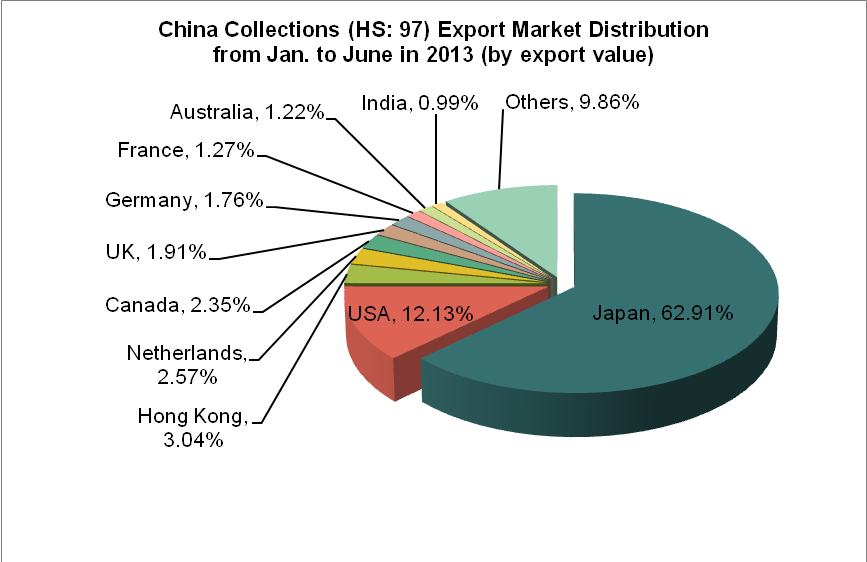
From Jan. to June in 2013, among the top ten export destination countries/regions, the export volume of Japan increased the largest (with an increase of 153.9% year on year), followed by Hong Kong (with an increase of 131.6% year on year), while the export value of India increased the largest (with an increase of 1061.1% year on year), followed by Hong Kong (with an increase of 227.7% year on year).
Source: Customs Information Network


