2010-2012 Republic of Korea Tubes, Pipes and Hollow Profiles, Seamless, of Iron or Steel Import Value Trend
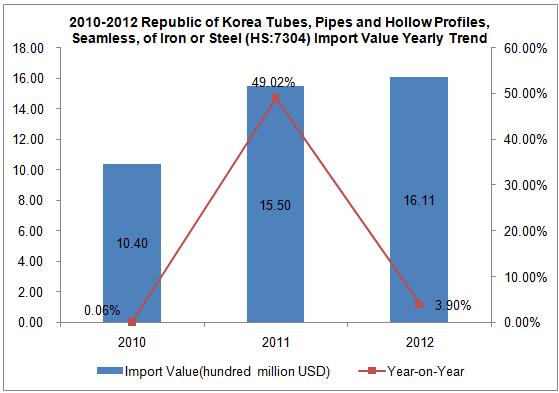
The Republic of Korea's Tubes, Pipes and Hollow Profiles, Seamless, of Iron or Steel import value increased year on year from 2010 to 2012. The import value of 2012 amounted to 16.11billion US dollars, increased by 3.9% year on year.
2010-2012 Republic of Korea Tubes, Pipes and Hollow Profiles, Seamless, of Iron or Steel Import Market Analysis
| No. | Import Countries/Regions | Import Value(Thousand USD) | 2012 Import Value Growth compared to 2010 | ||
| 2010 | 2011 | 2012 | |||
| 1 | China | 332,884 | 535,733 | 550,919 | 65.50% |
| 2 | Japan | 395,557 | 511,266 | 515,848 | 30.41% |
| 3 | Germany | 71,021 | 134,551 | 124,495 | 75.29% |
| 4 | USA | 102,435 | 117,125 | 72,891 | -28.84% |
| 5 | Italy | 31,816 | 45,318 | 71,078 | 123.40% |
| 6 | France | 20,609 | 51,629 | 61,818 | 199.96% |
| 7 | India | 18,026 | 29,456 | 39,207 | 117.50% |
| 8 | Spain | 16,903 | 26,259 | 26,824 | 58.69% |
| 9 | United Kingdom | 7,400 | 16,045 | 23,495 | 217.50% |
| 10 | Mexico | 177 | 3,312 | 20,362 | 11403.95% |
| 11 | Sweden | 11,565 | 15,850 | 18,700 | 61.69% |
| 12 | Brazil | 951 | 8,404 | 18,590 | 1854.78% |
| 13 | Singapore | 4,506 | 3,325 | 7,879 | 74.86% |
| 14 | United Arab Emirates | 1,697 | 3,685 | 7,738 | 355.98% |
| 15 | Netherlands | 2,047 | 6,029 | 7,352 | 259.16% |
| 16 | Norway | 6,008 | 5,182 | 6,063 | 0.92% |
| 17 | Australia | 1,015 | 1,298 | 5,868 | 478.13% |
| 18 | Romania | 160 | 3,086 | 5,391 | 3269.38% |
| 19 | Ukraine | 762 | 3,750 | 3,723 | 388.58% |
| 20 | Austria | 939 | 2,434 | 3,190 | 239.72% |
From 2010 to 2012; China, Japan and Germany were the top three largest import markets, for the Republic of Korea in Tubes, Pipes and Hollow Profiles, Seamless, of Iron or Steel. Among the Republic of Korea top twenty Tubes, Pipes and Hollow Profiles, Seamless, of Iron or Steel import markets in 2012, the import value from Italy, France, India, United Kingdom, Mexico, Brazil, United Arab Emirates, Netherlands, Australia, Romania, Ukraine and Austria for Tubes, Pipes and Hollow Profiles, Seamless, of Iron or Steel increased by 123.40%, 199.96%, 117.50%, 217.50%, 11403.95%, 1854.78%, 355.98%, 259.16%, 478.13%, 3269.38%, 388.58% and 239.72% compared to that of 2010, increased quickly ,which had increased more than 100%.
2010-2012 Republic of Korea Tubes, Pipes and Hollow Profiles, Seamless, of Iron or Steel Import Market Share Analysis
| No. | Import Countries/Regions | Import Value Percentage | ||
| 2010 | 2011 | 2012 | ||
| 1 | China | 31.99% | 34.55% | 34.20% |
| 2 | Japan↓ | 38.02% | 32.97% | 32.02% |
| 3 | Germany | 6.83% | 8.68% | 7.73% |
| 4 | USA↓ | 9.85% | 7.55% | 4.52% |
| 5 | Italy | 3.06% | 2.92% | 4.41% |
| 6 | France↑ | 1.98% | 3.33% | 3.84% |
| 7 | India↑ | 1.73% | 1.90% | 2.43% |
| 8 | Spain | 1.62% | 1.69% | 1.67% |
| 9 | United Kingdom↑ | 0.71% | 1.03% | 1.46% |
| 10 | Mexico↑ | 0.02% | 0.21% | 1.26% |
| 11 | Sweden | 1.11% | 1.02% | 1.16% |
| 12 | Brazil↑ | 0.09% | 0.54% | 1.15% |
| 13 | Singapore | 0.43% | 0.21% | 0.49% |
| 14 | United Arab Emirates↑ | 0.16% | 0.24% | 0.48% |
| 15 | Netherlands↑ | 0.20% | 0.39% | 0.46% |
| 16 | Norway | 0.58% | 0.33% | 0.38% |
| 17 | Australia | 0.10% | 0.08% | 0.36% |
| 18 | Romania↑ | 0.02% | 0.20% | 0.33% |
| 19 | Ukraine | 0.07% | 0.24% | 0.23% |
| 20 | Austria↑ | 0.09% | 0.16% | 0.20% |
Note: “↑”represents that the indicators listed continued to increase from 2010 to 2012“↓”represents that the indicators listed continued to decrease from 2010 to 2012.
Judging from the three year market share, the proportion of import value for France, India, United Kingdom, Mexico, Brazil, United Arab Emirates, Netherlands, Romania and Austria continued to rise, while only that of Japan and USA continued to decline.
Republic of Korea Tubes, Pipes and Hollow Profiles, Seamless, of Iron or Steel Import from Jan. to Nov. 2013
| Countries/Regions | Total Imports (Thousand USD) from Jan. to Dec. 2013 | Year-on-Year | Percentage |
| Total | 1,722,297 | 6.66% | 100.00% |
| Japan | 537,162 | -1.08% | 31.19% |
| China | 458,869 | -12.84% | 26.64% |
| Germany | 190,332 | 52.88% | 11.05% |
| USA | 131,187 | 80.75% | 7.62% |
| France | 119,606 | 132.57% | 6.94% |
| Spain | 66,366 | 146.28% | 3.85% |
| Italy | 58,341 | -28.67% | 3.39% |
| Norway | 22,202 | 1016.24% | 1.29% |
| United Kingdom | 16,797 | -0.25% | 0.98% |
| India | 16,462 | -24.02% | 0.96% |
According to the data statistics from Jan. to Dec., Japan was the first largest Original country of imported goods, amounted for 31.19% of Republic of Korea's total imports. The second largest Original country of imported goods was China, which amounted to 26.64% of its total imports. The third largest original country of imported goods was Germany, which amounted for 11.05% of its total imports.


