China Toys Main Exported Products from Jan. to Dec. 2014
| Product Name | Unit | Volume |
Value
| Compared with the Same Period of Last Year | |
| Volume |
Value
| ||||
| 95030089 Other Toys | Piece | 24,606,187,162 | 5,007,950,720 | 8% | 9.2% |
| 95030021 Toy Representing Animals | Piece | 1,730,787,798 | 2,018,431,587 | 9.9% | 16.1% |
| 95030081 Put up in sets or outfits | Piece | 1,668,792,486 | 1,715,440,336 | 9.7% | 32.1% |
| 95030082 Other Toys and Models, Incorporating a Motor | Piece | 386,240,846 | 1,580,004,341 | 26.6% | 17.6% |
| 95030010 Cars and Similar Wheeled Toys; Doll’s Carriage | Kg | 290,040,337 | 1,218,254,596 | 10% | 14.5% |
| 95030060 Puzzles | Piece | 619,040,572 | 1,180,742,695 | 23% | 15.3% |
| 95030029 Dolls | Piece | 705,399,503 | 762,037,476 | -5.4% | 13% |
| 95030090 Toys Parts and Accessories | Kg | 26,272,111 | 315,451,845 | 6.5% | 5.1% |
| 95030039 Other toy cars, reduced-size model assembly kits | Piece | 54,560,146 | 188,383,827 | -10.7% | -9.6% |
| 95030050 Toy Musical Instruments and Apparatus | Kg | 15,624,714 | 90,792,714 | -2.1% | -5.7% |
| 95030031 Electric Trains, Reduced-Size Model Assembly Kits | Kg | 2,710,328 | 40,723,149 | 16.1% | 25% |
| 95030040 Other construction sets/toys, reduced-size model assembly kits | Piece | 1,287,687 | 17,435,114 | -44.6% | 19.9% |
China Toys Export Analysis from Jan. to Dec. 2014
China Toys Export Volume and Value from Jan. to Dec. 2014
| Month | Volume ( - ) | Value (USD) | Compared with the Same Period of Last Year | |
| Volume | Value | |||
| Jan. | 5,056,474,590 | 1,010,457,620 | 69.4% | 19.9% |
| Feb. | 1,210,817,647 | 510,740,813 | -35.5% | -10.8% |
| Mar. | 2,021,011,165 | 762,875,050 | 44.8% | 19.2% |
| Apr. | 2,187,149,574 | 967,998,987 | 18.8% | 24% |
| May | 1,979,738,589 | 973,253,827 | 3% | 12.7% |
| Jun. | 2,062,477,354 | 1,073,282,869 | 9.3% | 12.8% |
| Jul. | 2,355,218,142 | 1,523,391,355 | 12.9% | 17.5% |
| Aug. | 1,888,459,575 | 1,719,865,817 | -21.6% | 13.1% |
| Sept. | 2,282,450,483 | 1,696,161,974 | 5.6% | 14.1% |
| Oct. | 2,683,273,291 | 1,661,230,779 | 40% | 6.5% |
| Nov. | 2,906,625,662 | 1,176,312,510 | -6.8% | 20.1% |
| Dec. | 3,473,247,618 | 1,060,076,799 | -17.4% | 19.6% |
| Jan. to Dec. Total | 30,106,943,690 | 14,135,648,400 | 8.3% | 14.2% |
China Toy export value has reached 14.14 billion USD, increased by 14.2% compared to the same period of last year.
China Toys Major Export Countries/Regions from Jan. to Dec. 2014
| No. | Country/Region | Volume (-) | Value (USD) | Compared with the Same Period of Last Year | |
| Volume | Value | ||||
| 1 | United States | 5,778,049,954 | 4,816,756,669 | -3.6% | 11.7% |
| 2 | Hong Kong | 1,261,140,627 | 871,696,628 | 3.4% | -2.1% |
| 3 | United Kingdom | 725,110,770 | 850,766,978 | 6.2% | 17.1% |
| 4 | Philippines | 1,312,226,250 | 629,025,229 | 33.9% | 38.9% |
| 5 | Japan | 641,174,399 | 586,663,237 | -7.4% | 5.1% |
| 6 | Germany | 561,303,463 | 539,941,923 | -5.1% | 13.2% |
| 7 | Singapore | 873,000,034 | 511,116,334 | 78.2% | 55.9% |
| 8 | Russian Federation | 576,208,199 | 342,540,306 | 50.9% | 9% |
| 9 | Netherlands | 657,844,211 | 334,202,457 | 38.2% | 36.7% |
| 10 | Republic of Korea | 365,677,528 | 321,417,966 | 64.8% | 58.4% |
| 11 | Canada | 339,965,715 | 311,283,100 | 16.8% | 8.8% |
| 12 | Mexico | 660,902,342 | 302,723,496 | 6.3% | 6.5% |
| 13 | Australia | 544,011,158 | 295,347,872 | 25.7% | 4% |
| 14 | France | 249,879,925 | 274,364,555 | -13.1% | -3.5% |
| 15 | Spain | 324,870,402 | 223,740,099 | 26.7% | 26.8% |
| 16 | Belgium | 302,507,181 | 215,569,769 | 17% | 12.5% |
| 17 | Italy | 421,257,179 | 206,925,865 | 17.3% | 12.7% |
| 18 | United Arab Emirates | 398,454,885 | 205,725,474 | 31.1% | 40.5% |
| 19 | Brazil | 238,852,874 | 186,028,878 | 0 | 9.6% |
| 20 | Chile | 913,731,516 | 181,410,601 | 40.2% | 22.2% |
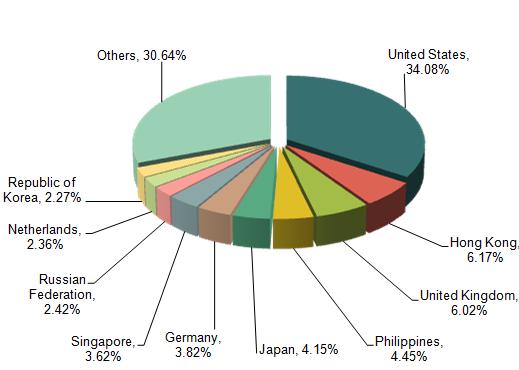
The export data from Jan. to Dec.2014 shows that China Toys main export markets are the United States, Hong Kong, United Kingdom, Philippines, Japan, Germany, Singapore, Russian Federation, Netherlands and South Korea.
The United States, Hong Kong and United Kingdom are the top three export markets of China Toy industry, separately accounting for 34.08%, 6.17% and 6.02% of the total export value.
Among the top 20 export markets from Jan. to Dec. 2014, the import value of South Korea enjoyed the highest growth rate, increasing 58.4% compared to the same period of 2013.
Regions of Origin for Exported Chinese Toys, from Jan. to Dec. 2014
| No. | Regions | Volume (-) | Value (USD) | Compared with the same period last year | |
| Volume | Value | ||||
| 1 | Guangdong | 11,193,212,863 | 9,533,293,710 | 14.7% | 12.9% |
| 2 | Zhejiang | 4,318,371,775 | 1,840,940,643 | -1% | 29.3% |
| 3 | Jiangsu | 3,385,759,377 | 1,184,955,824 | 8.8% | 10.7% |
| 4 | Shanghai | 283,491,211 | 346,086,404 | 24.5% | 0.4% |
| 5 | Shandong | 238,549,174 | 331,533,425 | 13.7% | 14.2% |
| 6 | Jiangxi | 271,655,103 | 278,442,100 | 1.8% | 6.1% |
| 7 | Fujian | 486,239,759 | 229,020,804 | -1.6% | 13.1% |
| 8 | Anhui | 144,691,790 | 226,101,858 | 15% | 20.7% |
| 9 | Hebei | 8,881,417,703 | 48,562,373 | 13.6% | 57.9% |
| 10 | Guangxi | 262,831,179 | 34,273,307 | 26% | 2.7% |
| 11 | Beijing | 125,911,822 | 15,397,220 | 57.9% | -5.4% |
| 12 | Henan | 7,744,288 | 15,394,960 | -89.1% | -40.2% |
| 13 | Chongqing | 38,668,021 | 13,814,051 | 26.5% | 47% |
| 14 | Liaoning | 18,924,501 | 9,580,108 | -2.4% | 21.3% |
| 15 | Tianjin | 73,467,720 | 7,890,295 | 499.9% | 21.2% |
| 16 | Hunan | 6,350,283 | 7,443,266 | 301.8% | 130.9% |
| 17 | Hubei | 365,833,876 | 7,368,466 | -61.3% | -22.1% |
| 18 | Xinjiang | 1,093,852 | 3,495,852 | -72.3% | -13% |
| 19 | Jilin | 811,224 | 834,807 | 131.1% | -30.4% |
| 20 | Shanxi | 298,279 | 362,175 | 1737.1% | 659.8% |
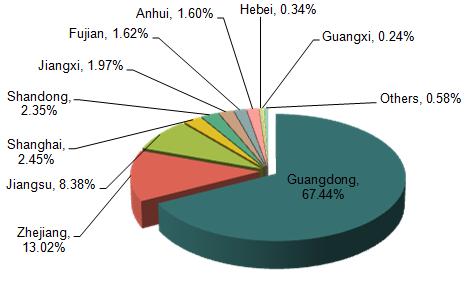
China Toys Original Places of Exported Goods are Guangdong, Zhejiang and Jiangsu. The total export volume of the above three provinces from Jan. to Dec. 2014 accounted for 62.77% of the total export Volume of China Toys industry, with the export value accounting for 88.85%.
Among the top 20 export markets from Jan. to Dec. 2014, the export value of Shanxi enjoyed the highest growth rate, increasing 659.8% compared to the same period of last year.
Source: China Customs


