2011-2013 China Other Golf Equipment Export Volume Trend
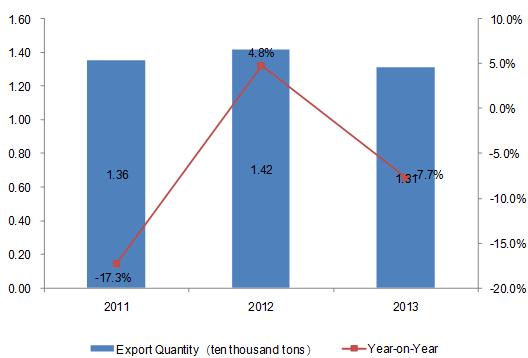
China export volume of other golf equipment showed an inverted V-shaped trend from 2011 to 2013, and the export volume for the three years amounted to 13,600 tons (a year-on-year decrease of 17.3%), 14,200 tons (a year-on-year increase of 4.8%) and 13,100 tons (a year-on-year decrease of 7.7%) respectively.
2011-2013 China Other Golf Equipment Export Value Trend
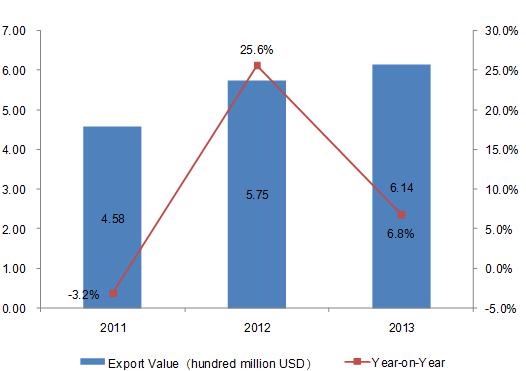
China export value of other golf equipment increased year by year from 2011 to 2013, and the export value for the three years amounted to 458 million US dollars (a year-on-year decrease of 3.2%), 575 million US dollars (a year-on-year increase of 25.6%) and 614 million US dollars (a year-on-year increase of 6.8%) respectively.
2011-2013 China Other Golf Equipment Export Average Unit Price Trend
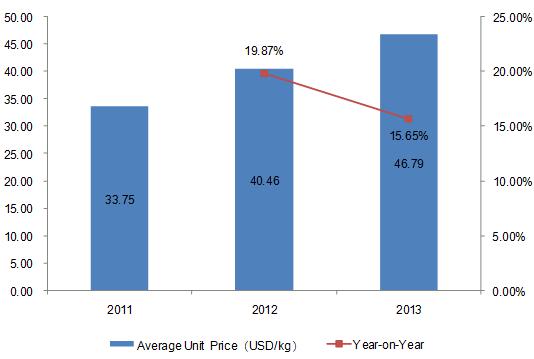
China average export unit price of other golf equipment increased year by year from 2011 to 2013. The average export unit price for 2013 was 46.79 USD/kg, which increased by 15.65% compared with the same period of 2012
2011-2013 China Other Golf Equipment Export Market Trends Analysis
2011-2013 China Other Golf Equipment Export Value Growth to Major Export Countries/Regions
| No. | Export Countries/Regions | Export Value (USD) | Export Value Growth Compared 2013 with 2011 | ||
| 2011 | 2012 | 2013 | |||
| 1 | Hong Kong | 220,771,383 | 267,835,389 | 294,733,424 | 33.50% |
| 2 | USA | 139,998,386 | 157,906,537 | 148,561,993 | 6.12% |
| 3 | Japan | 44,186,942 | 62,340,850 | 58,512,181 | 32.42% |
| 4 | Mexico | 8,933,523 | 19,850,314 | 38,074,416 | 326.20% |
| 5 | United Kingdom | 17,303,502 | 27,275,005 | 23,384,850 | 35.15% |
| 6 | Taiwan | 8,673,907 | 9,406,359 | 13,315,700 | 53.51% |
| 7 | Australia | 2,362,930 | 4,132,002 | 4,064,364 | 72.01% |
| 8 | Republic of Korea | 3,207,660 | 3,926,406 | 4,055,823 | 26.44% |
| 9 | Netherlands | 800,120 | 2,165,465 | 3,850,111 | 381.19% |
| 10 | Canada | 3,169,580 | 6,290,162 | 3,270,706 | 3.19% |
| 11 | Singapore | 147,680 | 1,062,181 | 2,979,646 | 1917.64% |
| 12 | Iran | 12,885 | 225,822 | 2,699,729 | 20852.50% |
| 13 | Viet Nam | 1,036,117 | 2,782,558 | 2,360,413 | 127.81% |
| 14 | Germany | 1,749,640 | 1,286,663 | 1,723,196 | -1.51% |
| 15 | Malaysia | 71,385 | 496,080 | 1,714,174 | 2301.31% |
| 16 | Kuwait | 0 | 0 | 780,637 | / |
| 17 | Panama | 7,149 | 0 | 779,963 | 10810.10% |
| 18 | South Africa | 624,943 | 1,007,680 | 767,701 | 22.84% |
| 19 | United Arab Emirates | 526,950 | 294,237 | 749,809 | 42.29% |
| 20 | France | 561,020 | 190,836 | 700,135 | 24.80% |
The three largest export markets of Chinese other golf equipment are Hong Kong, the United States and Japan. China's export values to Hong Kong, the United States and Japan in 2013 are 295 million US dollars, 149 million US dollars and 58.5122 million US dollars respectively, an increase of 33.5%, 6.12% and 32.42% compared with the same period of 2011. Among the twenty export markets above, the export value of China to Iran, Panama, Malaysia, Singapore, the Netherlands, Mexico and Vietnam increased significantly, an increase of 20852.5%, 10810.1%, 2301.31%, 1917.64%, 381.19%, 326.2% and 127.81%.
2011-2013 China Other Golf Equipment Major Export Countries/Regions Market Share Trend
| No. | Export Countries/Regions | Export Value Percentage | ||
| 2011 | 2012 | 2013 | ||
| 1 | Hong Kong | 48.24% | 46.58% | 48.00% |
| 2 | USA↓ | 30.59% | 27.46% | 24.20% |
| 3 | Japan | 9.66% | 10.84% | 9.53% |
| 4 | Mexico↑ | 1.95% | 3.45% | 6.20% |
| 5 | United Kingdom | 3.78% | 4.74% | 3.81% |
| 6 | Taiwan | 1.90% | 1.64% | 2.17% |
| 7 | Australia | 0.52% | 0.72% | 0.66% |
| 8 | Republic of Korea↓ | 0.70% | 0.68% | 0.66% |
| 9 | Netherlands↑ | 0.17% | 0.38% | 0.63% |
| 10 | Canada | 0.69% | 1.09% | 0.53% |
| 11 | Singapore↑ | 0.03% | 0.18% | 0.49% |
| 12 | Iran↑ | / | 0.04% | 0.44% |
| 13 | Viet Nam | 0.23% | 0.48% | 0.38% |
| 14 | Germany | 0.38% | 0.22% | 0.28% |
| 15 | Malaysia↑ | 0.02% | 0.09% | 0.28% |
| 16 | Kuwait | / | / | 0.13% |
| 17 | Panama | / | / | 0.13% |
| 18 | South Africa | 0.14% | 0.18% | 0.13% |
| 19 | United Arab Emirates | 0.12% | 0.05% | 0.12% |
| 20 | France | 0.12% | 0.03% | 0.11% |
Note: “↑”represents that the indicators listed continued to increase from 2011 to 2013, “↓”represents that the indicators listed continued to decrease from 2011 to 2013.
The data of 2013 shows that Hong Kong, the USA and Japan, the three largest export markets of other golf equipment from China, accounted for 48%, 24.2% and 9.53% of the total export value respectively.
Judging from the export market share trends, the market share for Mexico, the Netherlands, Singapore, Iran and Malaysia continued to rise, while that for the USA, and South Korea continued to decline.


