China Bearing Industry Export Classification Tables of 2012
| HS Code | Product Name | Measuring Unit | Volume | Value | Year on Year | |
|
|
|
|
| (100 Million USD) | Volume | Value |
| 8482 | Ball or roller bearings | Piece | 4,631,517,978 | 42.09 | -9.0% | -3.1% |
| 848210 | Ball Bearing | Set | 3,773,329,295 | 20.36 | -9.7% | -2.2% |
| 848220 | Tapered roller bearings, including cone and tapered roller assemblies | Set | 191,279,153 | 5.06 | -15.6% | -14.1% |
| 848230 | Spherical roller bearings | Set | 6,320,015 | 1.87 | -8.5% | -13.5% |
| 848240 | Needle roller bearings | Set | 318,547,473 | 1.79 | -4.2% | 34.1% |
| 848250 | Other cylindrical roller bearings | Set | 52,153,282 | 1.57 | 63.3% | 0.9% |
| 848280 | Bearing housings, not incorporating ball or roller bearings; plain shaft bearings | Set | 65,597,186 | 1.32 | 7.2% | 14.6% |
| 848299 | Other | Kg | 129,788,831 | 7.19 | -11.3% | -3.0% |
| 848320 | Tapered roller bearings, including cone and tapered roller assemblies | Piece | 58,281,572 | 1.63 | -1.2% | -1.0% |
| 848330 | Bearing housings, not incorporating ball or roller bearings; plain shaft bearings | Piece | 2,468,395,700 | 4.84 | -2.0% | 2.9% |
| 91149010 | Jewel bearings | Kg | 4,331 | 0.07 | / | / |
China Ball or Roller Bearings (HS: 8482) Export Trend Analysis from 2010 to 2012
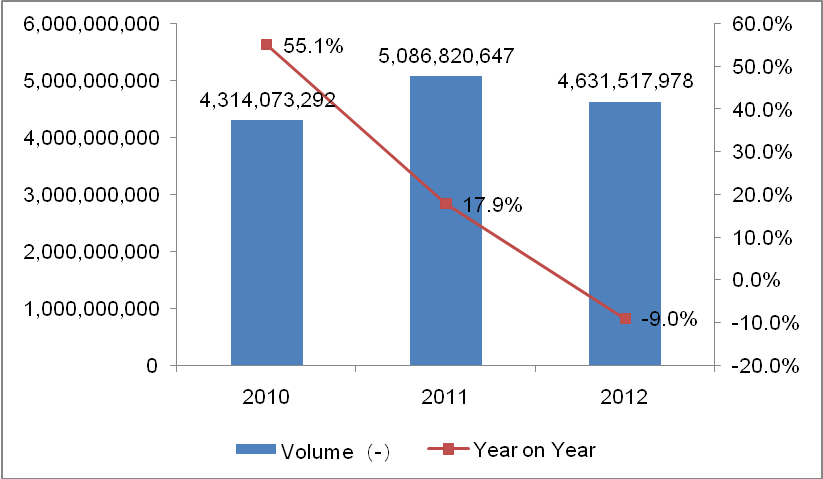
China Ball or Roller Bearings Export Volume Annual Trend from 2010 to 2012
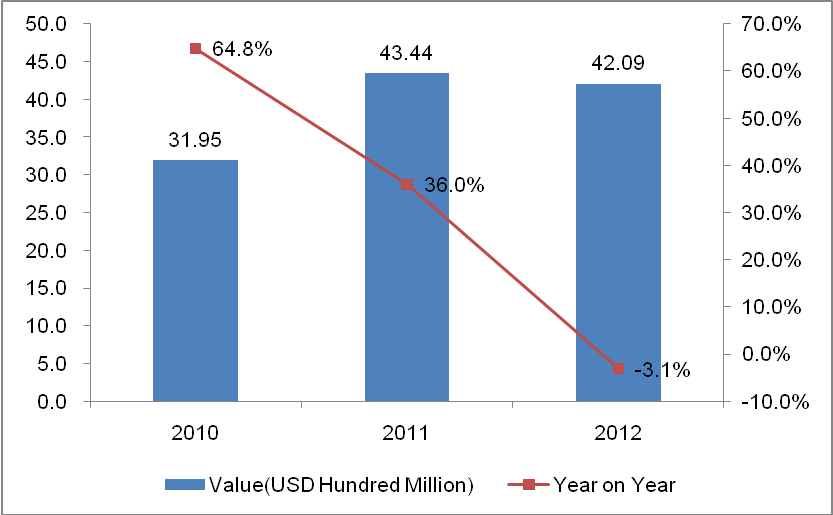
China Ball or Roller Bearings Export Value Annual Trend from 2010 to 2012
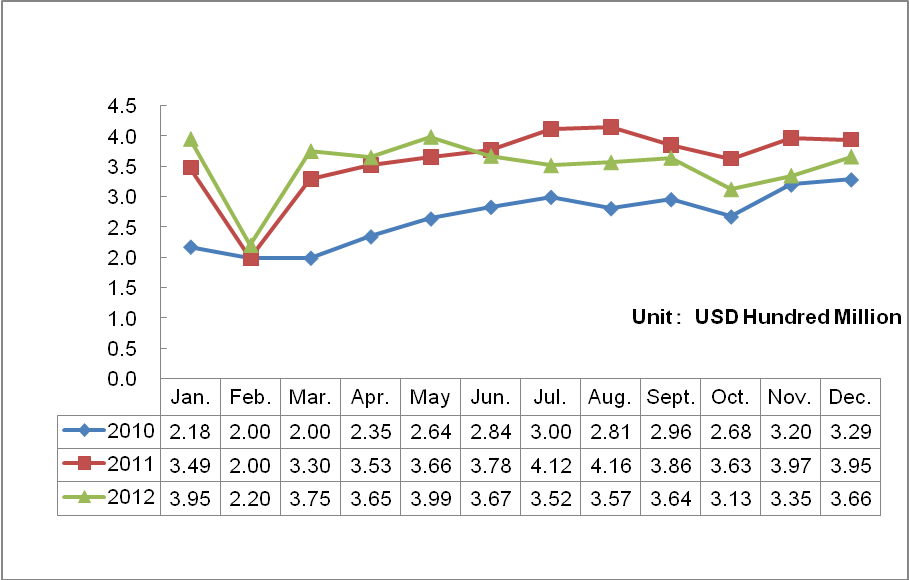
China Ball or Roller Bearings Export Volume Monthly Trend from 2010 to 2012
China ball or roller bearings export volume annual trend inverted "V" type from 2010 to 2012, and export volume of 2011 increased by 17.9% year on year, while export volume of 2012 decreased by 9% year on year.
China ball or roller bearings total export value of 2011 reached 4.344 billion US dollars, with an increase of 36%, while export value of 2012 reached 429 million US dollars, with a decrease of 3.1%.
Seen from exports monthly trend from 2010 to 2012, monthly exportation in 2010 is relatively stable. February of both 2011 and 2012 exported the lowest value of the whole year, and the trend is obvious.
China Ball or Roller Bearings Export Market Trend from 2010 to 2012
| No. | Countries/Regions | China Export Value to main Countries/Regions | Export Value Increase Compared 2012 with 2010 | ||
|
|
| (Unit: 100 Million USD) |
| ||
|
|
| 2010 | 2011 | 2012 |
|
| 1 | USA↑ | 4.44 | 6.02 | 6.3 | 41.89% |
| 2 | India↑ | 2.2 | 2.96 | 3.17 | 44.09% |
| 3 | Japan↑ | 2.48 | 2.75 | 2.76 | 11.29% |
| 4 | Republic of Korea | 2.21 | 2.83 | 2.69 | 21.72% |
| 5 | Germany | 1.92 | 2.74 | 2.62 | 36.46% |
| 6 | Italy | 1.66 | 2.31 | 1.85 | 11.45% |
| 7 | Brazil | 1.19 | 1.56 | 1.53 | 28.57% |
| 8 | Hong Kong | 1.57 | 1.75 | 1.41 | -10.19% |
| 9 | France | 1.18 | 1.57 | 1.34 | 13.56% |
| 10 | Malaysia↑ | 0.43 | 0.93 | 1.32 | 206.98% |
China Ball or Roller Bearings Major Export Market Share Trend from 2010 to 2012
| No. | Countries/Regions | Market Share | ||
|
|
| 2010 | 2011 | 2012 |
| 1 | USA | 13.9% | 13.9% | 15.0% |
| 2 | India | 6.9% | 6.8% | 7.5% |
| 3 | Japan | 7.8% | 6.3% | 6.6% |
| 4 | Republic of Korea ↓ | 6.9% | 6.5% | 6.4% |
| 5 | Germany | 6.0% | 6.3% | 6.2% |
| 6 | Italy | 5.2% | 5.3% | 4.4% |
| 7 | Brazil | 3.7% | 3.6% | 3.6% |
| 8 | Hong Kong↓ | 4.9% | 4.0% | 3.3% |
| 9 | France↓ | 3.7% | 3.6% | 3.2% |
| 10 | Malaysia↑ | 1.4% | 2.1% | 3.1% |
Note: “↑”represents the indicators on the list continued to rise from 2010 to 2012, “↓”represents the indicators on the list continued to decrease from 2010 to 2012.
In 2012, China Ball or Roller Bearings main export markets are USA, India, Japan, Korea, Germany, Italy, Brazil, Hong Kong, France and Malaysia. The export value of china ball or roller bearings to these countries which continued to rise in the three years are USA, India, Japan and Malaysia. Among these main export markets which continued increasing in market share from 2010 to 2012 is Malaysia, and with South Korea, Hong Kong and France declining.
China Ball or Roller Bearings Export Source Area Trend from 2010 to 2012
| No. | Regions | Export Value(Unit: 100 Million USD) | Export Value Increase Compared 2012 with 2010 | ||
|
|
|
|
| ||
|
|
| 2010 | 2011 | 2012 |
|
| 1 | Zhejiang | 11.35 | 15.56 | 13.86 | 22.11% |
| 2 | Jiangsu | 6.56 | 9.03 | 8.94 | 36.28% |
| 3 | Shanghai | 4.96 | 6.03 | 5.79 | 16.73% |
| 4 | Shandong | 2.55 | 3.73 | 3.45 | 35.29% |
| 5 | Guangdong↑ | 1.30 | 1.71 | 2.42 | 86.15% |
| 6 | Liaoning↑ | 1.67 | 2.10 | 2.29 | 37.13% |
| 7 | Hebei↑ | 0.42 | 0.64 | 0.74 | 76.19% |
| 8 | Fujian | 0.53 | 0.67 | 0.67 | 26.42% |
| 9 | Henan | 0.40 | 0.65 | 0.51 | 27.50% |
| 10 | Gansu↑ | 0.33 | 0.46 | 0.47 | 42.42% |
China Ball or Roller Bearings Export Source Area Market Share Trend from 2010 to 2012.
| No. | Regions | Market Share | ||
|
|
| 2010 | 2011 | 2012 |
| 1 | Zhejiang | 35.5% | 35.8% | 32.9% |
| 2 | Jiangsu↑ | 20.5% | 20.8% | 21.2% |
| 3 | Shanghai↓ | 15.5% | 13.9% | 13.8% |
| 4 | Shandong | 8.0% | 8.6% | 8.2% |
| 5 | Guangdong | 4.1% | 3.9% | 5.8% |
| 6 | Liaoning | 5.2% | 4.8% | 5.4% |
| 7 | Hebei↑ | 1.3% | 1.5% | 1.8% |
| 8 | Fujian | 1.7% | 1.5% | 1.6% |
| 9 | Henan | 1.3% | 1.5% | 1.2% |
| 10 | Gansu | 1.0% | 1.1% | 1.1% |
Note: “↑”represents the indicators on the list continued to rise from 2010 to 2012, “↓”represents the indicators on the list continued to decrease from 2010 to 2012.
In 2012, China Ball or Roller Bearings main export source areas are Zhejiang, Jiangsu and Shanghai. From 2010 to 2012, Jiangsu Ball or Roller Bearings export market share continued to rise, while Shanghai continued to decline in the three years.
Source: Customs Information Network


