HS: 9503, Tricycles, scooters, pedal cars and similar wheeled toys; dais carriages5 dolls; Other toys; reduced-size ("scale") models and similar recreational models working or not; puzzles of all kinds, hereinafter referred to as "toy".
The United States Toy (HS: 9503) Industry Imports from 2010 to 2012
The United States Toy Import Value Annual Trend from 2010 to 2012
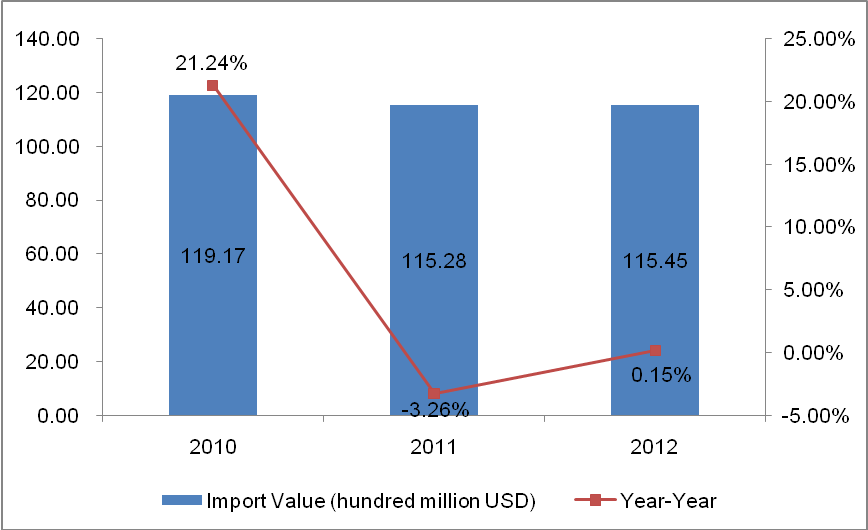
The import value of the United States toy showed a trend of "V" from 2010 to 2012. The import value of the three years amounted to 11.917 billion US dollars (with an increase of 21.24% year on year), 11.528 billion US dollars (with a decrease of 3.26% year on year) and 11.545 billion US dollars (with an increase of 0.15% year on year).
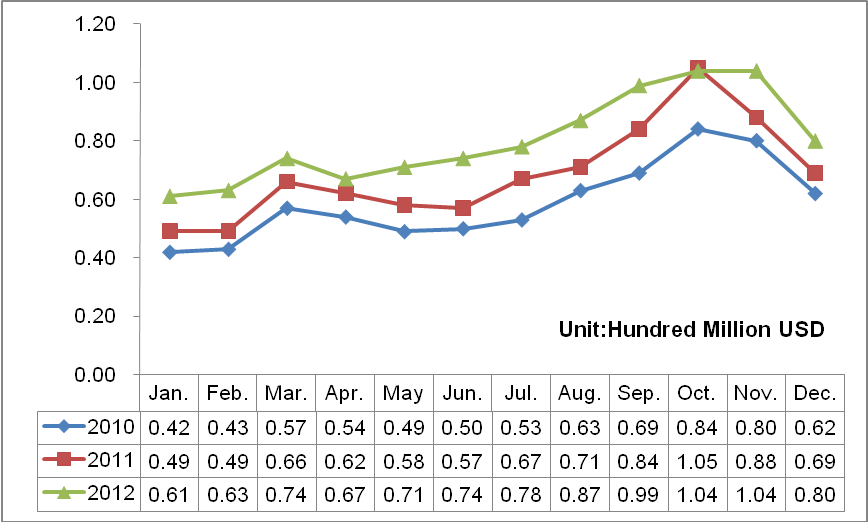
The United States Toy Import Value Monthly Trend from 2010 to 2012
The United States Toy Major Sourcing Countries/Regions from 2010 to 2012
(Unit: Thousand USD)
| Countries/Regions | 2010 | 2011 | 2012 |
| China | 10,419,111 | 9,979,394 | 9,887,161 |
| Mexico | 290,038 | 367,060 | 575,396 |
| Indonesia | 177,120 | 185,272 | 201,222 |
| Taiwan | 142,753 | 148,270 | 172,921 |
| Vietnam | 88,575 | 96,605 | 117,601 |
| Hong Kong | 54,504 | 77,154 | 82,019 |
| Canada | 85,281 | 61,851 | 78,166 |
| Denmark | 272,587 | 234,066 | 73,321 |
| Thailand | 86,899 | 72,720 | 70,719 |
| Germany | 49,054 | 48,675 | 52,776 |
| Malaysia | 55,391 | 50,701 | 45,128 |
| Japan | 40,612 | 40,208 | 36,366 |
| Italy | 24,906 | 21,929 | 25,933 |
| UK | 13,834 | 16,894 | 15,621 |
| Czech | 15,451 | 20,050 | 12,324 |
| South Korea | 17,481 | 13,657 | 8,734 |
| Hungary | 11,443 | 11,308 | 7,970 |
| France | 5,702 | 8,029 | 7,910 |
| Philippines | 9,829 | 11,085 | 7,877 |
| Spain | 5,947 | 5,900 | 5,573 |
The United States Toy Major Sourcing Countries/Regions Market Share Trend from 2010 to 2012
| Countries/Regions | 2010 | 2011 | 2012 |
| China↓ | 87.43% | 86.57% | 85.64% |
| Mexico↑ | 2.43% | 3.18% | 4.98% |
| Indonesia↑ | 1.49% | 1.61% | 1.74% |
| Taiwan↑ | 1.20% | 1.29% | 1.50% |
| Vietnam↑ | 0.74% | 0.84% | 1.02% |
| Hong Kong↑ | 0.46% | 0.67% | 0.71% |
| Canada | 0.72% | 0.54% | 0.68% |
| Denmark↓ | 2.29% | 2.03% | 0.64% |
| Thailand↓ | 0.73% | 0.63% | 0.61% |
| Germany↑ | 0.41% | 0.42% | 0.46% |
| Malaysia↓ | 0.46% | 0.44% | 0.39% |
| Japan | 0.34% | 0.35% | 0.31% |
| Italy | 0.21% | 0.19% | 0.22% |
| UK | 0.12% | 0.15% | 0.14% |
| Czech | 0.13% | 0.17% | 0.11% |
| South Korea↓ | 0.15% | 0.12% | 0.08% |
| Hungary | 0.10% | 0.10% | 0.07% |
| France | 0.05% | 0.07% | 0.07% |
| Philippines | 0.08% | 0.10% | 0.07% |
| Spain | 0.05% | 0.05% | 0.05% |
Note: ↑represents that the proportion of the import value from the country accounting for the United States total import value continued to increase from 2010 to 2012, ↓represents that the proportion of the import value from the country accounting for the United States total import value continued to decrease from 2010 to 2012.
Judging from the export market share trend, the market share of Mexico, Indonesia, Taiwan, Vietnam, Hong Kong and Germany continued to increase while that of China, Denmark, Thailand and Malaysia continued to decrease from 2010 to 2012.
The United States Toy (HS: 9503) Industry Imports from Jan. to June of 2013
The United States Toy Import Value from Jan. to June of 2013
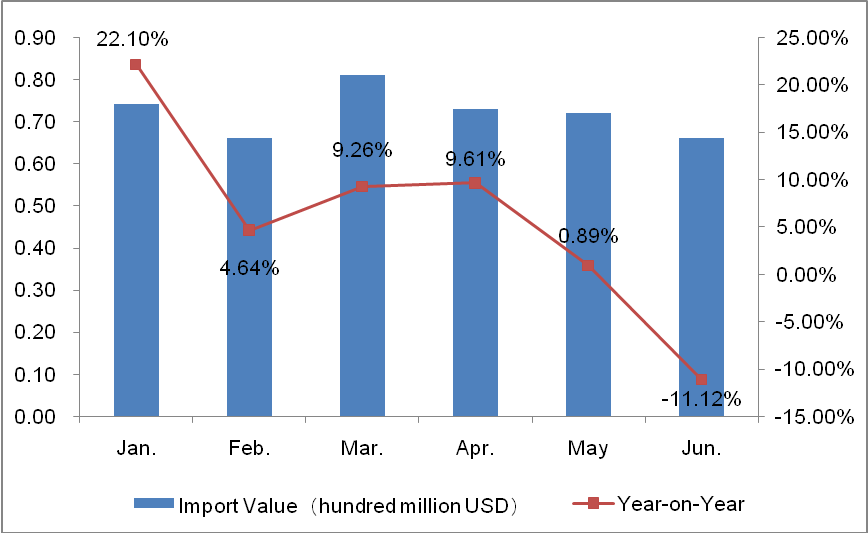
| Month | Value (hundred million USD) | Compared to the Same Period of Last Year |
| January | 0.74 | 22.10% |
| February | 0.66 | 4.64% |
| March | 0.81 | 9.26% |
| April | 0.73 | 9.61% |
| May | 0.72 | 0.89% |
| June | 0.66 | -11.12% |
| Jan.-June Total | 4.32 | 5.39% |
The import value of the United States toy amounted to about 432 million US dollars, with an increase of 5.39% year on year from Jan. to June in 2013.
The United States Toy Major Sourcing Countries/Regions from Jan. to June of 2013
| Countries/Regions | Value | Compared to the Same Period of Last Year |
| Canada | 224,519 | 5.14% |
| Mexico | 48,256 | 22.29% |
| UK | 30,843 | -2.50% |
| Australia | 21,374 | 37.20% |
| Japan | 8,985 | 2.04% |
| Hong Kong | 8,498 | 21.02% |
| Germany | 7,897 | 0.69% |
| Chile | 6,691 | 33.45% |
| South Korea | 4,043 | -19.61% |
| China | 3,522 | -20.26% |
| Netherlands | 3,273 | -31.21% |
| Saudi Arabia | 2,827 | 110.34% |
| Panama | 2,687 | 14.93% |
| Brazil | 2,522 | -12.03% |
| UAE | 2,407 | -2.83% |
| Dominica | 2,276 | 12.01% |
| South Africa | 2,245 | 37.31% |
| Singapore | 2,229 | -17.54% |
| Taiwan | 2,115 | -65.73% |
| Thailand | 2,022 | 232.57% |
From Jan. to June in 2013, among the top twenty sourcing countries/regions, the largest increase was in Thailand (with an increase of 232.57%) seen from the import value in proportion, followed by Saudi Arabia (with an increase of 110.34%). China ranked the tenth. From Jan. to June in 2013, the United States total import value of the products from China amounted to 3.522 million US dollars, with a decrease of 20.26%.
Source: UN COMTRADE


