2009-2011 Global Bathtub (HS:6910)Annual Imports Trend
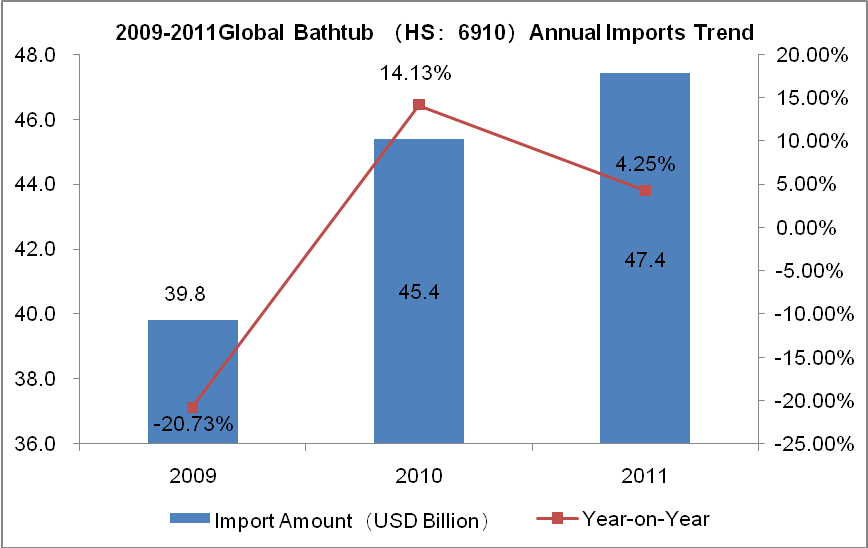
From 2009 to 2011, the total import amount of global ceramic sanitary is increasing year by year; in 2011 the total imports approximately $ 4.74 billion, with a year-on-year increase of 4.25%.
2009-2011 Global Bathtub (HS:6910)Major Import Countries and Import Amount
| Item | Import Countries & Regions | Import Amount (Thousand USD) | 2011 Compared With 2009 | ||
| Year 2009 | Year 2010 | Year 2011 | |||
| 1 | The USA | 735,666 | 843,637 | 812,584 | 10.46% |
| 2 | Germany | 243,402 | 265,301 | 313,268 | 28.70% |
| 3 | France | 240,121 | 264,814 | 311,938 | 29.91% |
| 4 | The United Kingdom | 248,980 | 260,857 | 284,614 | 14.31% |
| 5 | Canada | 182,281 | 218,427 | 190,564 | 4.54% |
| 6 | Spain | 198,127 | 222,254 | 159,240 | -19.63% |
| 7 | Italy | 110,173 | 124,299 | 137,365 | 24.68% |
| 8 | Russian Federation | 81,513 | 98,429 | 125,272 | 53.68% |
| 9 | Belgium | 107,189 | 120,361 | 119,040 | 11.06% |
| 10 | The Netherlands | 90,643 | 88,280 | 108,655 | 19.87% |
| 11 | Japan | 68,163 | 75,968 | 102,217 | 49.96% |
| 12 | South Korea | 69,965 | 85,048 | 97,170 | 38.88% |
| 13 | Australia | 68,472 | 80,760 | 92,121 | 34.54% |
| 14 | Austria | 58,716 | 63,321 | 77,449 | 31.90% |
| 15 | Switzerland | 54,970 | 59,091 | 75,124 | 36.66% |
| 16 | China | 29,037 | 43,028 | 66,922 | 130.47% |
| 17 | Sweden | 45,263 | 40,001 | 65,247 | 44.15% |
| 18 | Denmark | 69,876 | 65,322 | 59,262 | -15.19% |
| 19 | India | 23,192 | 36,697 | 54,487 | 134.94% |
| 20 | Arab | 49,483 | 44,577 | 48,568 | -1.85% |
The biggest importing country of Chinese ceramic sanitary is the USA; in 2011 the imports amounted to approximately $ 813 million, which represented a decrease of 3.68% compared to 2010. Germany and France were ranked second and third, in 2011 the import amount respectively increased by 18.08% and 17.80%. From 2009 to 2011, among the top 20 global ceramic sanitary importing countries, India becomes the largest importing country, with an increase of 134.94% compared to 2009; China is followed the import amount increased by 130.47%.
2009-2011 Global Bathtub (HS:6910)Major Import Market Share
| Item | Import Countries & Regions | Proportion of Import Amount | ||
| Year 2009 | Year 2010 | Year 2011 | ||
| 1 | The USA | 18.48% | 18.57% | 17.15% |
| 2 | Germany | 6.11% | 5.84% | 6.61% |
| 3 | France | 6.03% | 5.83% | 6.59% |
| 4 | The United Kingdom | 6.25% | 5.74% | 6.01% |
| 5 | Canada | 4.58% | 4.81% | 4.02% |
| 6 | Spain↓ | 4.98% | 4.89% | 3.36% |
| 7 | Italy | 2.77% | 2.74% | 2.90% |
| 8 | Russian Federation↑ | 2.05% | 2.17% | 2.64% |
| 9 | Belgium↓ | 2.69% | 2.65% | 2.51% |
| 10 | The Netherlands | 2.28% | 1.94% | 2.29% |
| 11 | Japan | 1.71% | 1.67% | 2.16% |
| 12 | South Korea↑ | 1.76% | 1.87% | 2.05% |
| 13 | Australia↑ | 1.72% | 1.78% | 1.94% |
| 14 | Austria | 1.47% | 1.39% | 1.63% |
| 15 | Switzerland | 1.38% | 1.30% | 1.59% |
| 16 | China↑ | 0.73% | 0.95% | 1.41% |
| 17 | Sweden | 1.14% | 0.88% | 1.38% |
| 18 | Denmark↓ | 1.76% | 1.44% | 1.25% |
| 19 | India↑ | 0.58% | 0.81% | 1.15% |
| 20 | Arab | 1.24% | 0.98% | 1.03% |
Note: ↑mean that from 2009 to 2011, the import amount kept rising in the proportion of China’s total import amount. ↓ mean that from 2009 to 2011, the import amount continued to decline in the proportion of China’s total import amount.
From the market share of recent three years, the import amount of Russian Federation, South Korea, Australia, China and India are keep rising, Spain, Belgium and Denmark continued to decline.
2009-2011 Global Bathtub (HS:6910)Major Export Country and Export Amount
| Item | Export Countries & Regions | Export Amount(Thousand USD) | Exports Increased 2011 compared with 2009 | ||
| Year 2009 | Year 2010 | Year 2011 | |||
| 1 | China | 667,628 | 778,974 | 845,721 | 26.68% |
| 2 | Germany | 354,560 | 360,451 | 408,653 | 15.26% |
| 3 | Mexico | 352,823 | 399,219 | 374,662 | 6.19% |
| 4 | Italy | 287,880 | 277,985 | 308,368 | 7.12% |
| 5 | Turkey | 139,036 | 156,909 | 178,537 | 28.41% |
| 6 | Spain | 127,216 | 126,887 | 146,492 | 15.15% |
| 7 | Poland | 116,227 | 125,738 | 137,507 | 18.31% |
| 8 | Thailand | 100,529 | 117,176 | 134,242 | 33.54% |
| 9 | Portugal | 146,551 | 141,275 | 130,382 | -11.03% |
| 10 | France | 122,037 | 131,212 | 128,384 | 5.20% |
| 11 | The USA | 123,547 | 119,099 | 127,588 | 3.27% |
| 12 | Sweden | 91,832 | 112,933 | 108,086 | 17.70% |
| 13 | Belgium | 84,006 | 82,456 | 106,925 | 27.28% |
| 14 | Czech | 67,726 | 74,275 | 94,994 | 40.26% |
| 15 | Bulgaria | 68,337 | 70,998 | 91,418 | 33.78% |
| 16 | Hungary | 56,427 | 59,400 | 65,058 | 15.30% |
| 17 | Colombia | 39,595 | 46,623 | 62,441 | 57.70% |
| 18 | Vietnam | 37,367 | 46,243 | 62,301 | 66.73% |
| 19 | Britain | 59,200 | 58,568 | 59,502 | 0.51% |
| 20 | Egypt | 84,790 | 83,727 | 59,271 | -30.10% |
China is the biggest exporting country of ceramic sanitary ware, in 2011 China's exports of ceramic sanitary products accounted for 19.76% of worldwide total exports. From 2009 to 2011, among the world's top 20 ceramic sanitary ware exporting countries, Vietnam is the fastest growing country with an increase of 66.73% compared to 2009.
2009-2011 Global Bathtub (HS:6910)Major Export Market Share
| Item | Export Countries & Regions | Proportion of Export Amount | ||
| Year 2009 | Year 2010 | Year 2011 | ||
| 1 | China ↑ | 17.98% | 19.34% | 19.76% |
| 2 | Germany | 9.55% | 8.95% | 9.55% |
| 3 | Mexico | 9.50% | 9.91% | 8.75% |
| 4 | Italy | 7.75% | 6.90% | 7.20% |
| 5 | Turkey ↑ | 3.75% | 3.90% | 4.17% |
| 6 | Spain | 3.43% | 3.15% | 3.42% |
| 7 | Poland | 3.13% | 3.12% | 3.21% |
| 8 | Thailand↑ | 2.71% | 2.91% | 3.14% |
| 9 | Portugal↓ | 3.95% | 3.51% | 3.05% |
| 10 | French↓ | 3.29% | 3.26% | 3.00% |
| 11 | The USA | 3.33% | 2.96% | 2.98% |
| 12 | Sweden | 2.47% | 2.80% | 2.53% |
| 13 | Belgium | 2.26% | 2.05% | 2.50% |
| 14 | Czech↑ | 1.82% | 1.84% | 2.22% |
| 15 | Bulgaria | 1.84% | 1.76% | 2.14% |
| 16 | Hungary | 1.52% | 1.48% | 1.52% |
| 17 | Colombia↑ | 1.07% | 1.16% | 1.46% |
| 18 | Vietnam↑ | 1.01% | 1.15% | 1.46% |
| 19 | English↓ | 1.59% | 1.45% | 1.39% |
| 20 | Egypt↓ | 2.28% | 2.08% | 1.38% |
Note: ↑mean that from 2009 to 2011, the export amounts keep rising in the proportion of China’s total export amount. ↓mean that from 2009 to 2011, the export amounts continue to decline in the proportion of China’s total export amount.
From the market share of recent three years, the import amount of China, Turkey, Thailand, the Czech Republic, Colombia and Vietnam is rising; Portugal, France, the United Kingdom and Egypt continued to decline.


