
StarTube
Monthly Business Report
EP01 Zhejiang Industrial Clusters
CONTENT
Abstract
1. Introduction of Zhejiang
2. Detailed Information On Zhejiang Industrial Clusters
3. National Fundamental Information
3.1 The United States
3.2 Australia
3.3 The United Kingdom
4. Tips for better sourcing
Abstract
This report contains detailed information on Zhejiang industrial clusters as well as an example macro-economical analysis of three major countries.
1. Introduction of Zhejiang
Zhejiang industrial cluster is a new geo-economic phenomenon that emerged after China launched its reform and opening up.
In practice, Zhejiang’s agglomeration of industrial organizations and their spatial morphology has shown high economic value, especially in terms of exerting regional comparative advantages, completing capital accumulation, and enhancing regional competitiveness.
Specializations have also emerged and flourished including Shaoxing’s textile industry group, Haining’s leather industry group, Yongkang’s hardware industry group, Yueqing’s low-voltage electrical industry group, and Tonglu’s pen industry group and so on. These dotted industrial clusters have become production and innovation bases for exploring international and domestic markets.
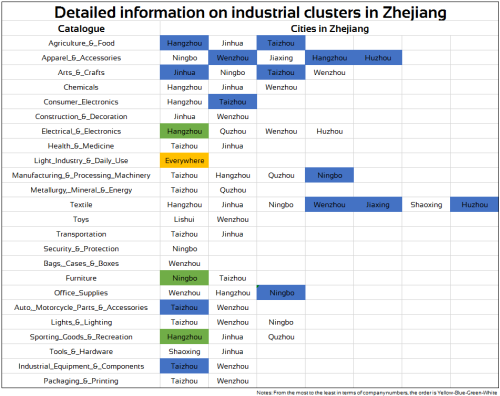
2. Detailed Information On Zhejiang Industrial Clusters
3. National Fundamental Information
General growth, inflation, savings rate and consumption of the country that your business operates are important considerations.
For convenience, we have selected light industry as an example. Light industry consists of products consumed within the family such as cups and tables etc.
In the current global market place, the top three countries in terms of light industry market share are USA, UK, and Australia. Within these countries, we can expect different developments in the coming year. Let’s take a deeper look.
3.1 The United States
US’s real GDP decreased 3.5 percent in 2020, compared with an increase of 2.2 percent in 2019.
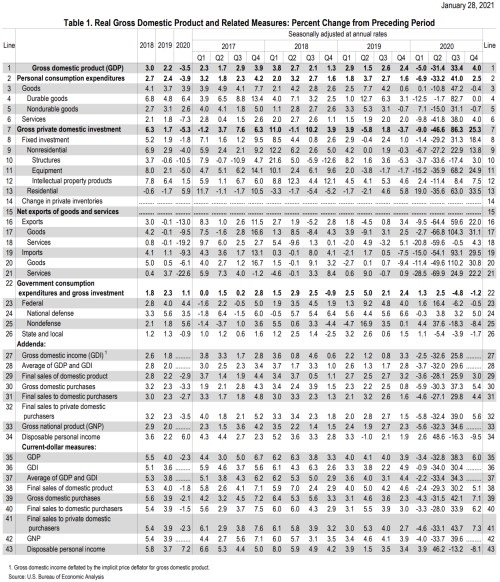
The decrease in real GDP in 2020 reflected decreases in PCE, exports, private inventory investment, nonresidential fixed investment, and state and local government expenditure that were partly offset by increases in federal government spending and residential fixed investment. Imports decreased.
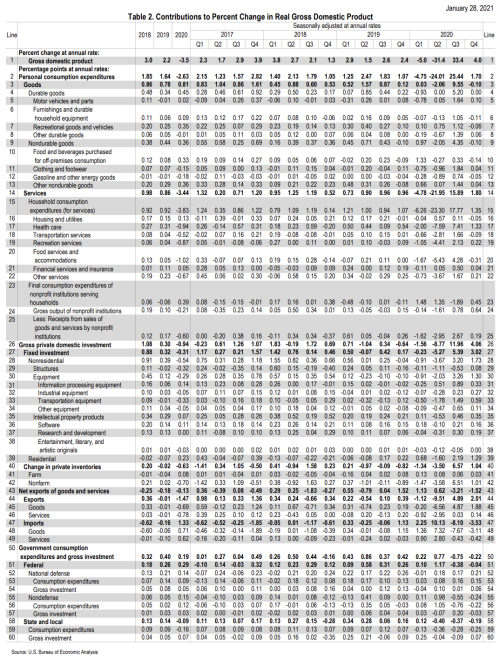
The decrease in PCE in 2020 was more than accounted for by a decrease in services (led by food services and accommodation, health care, and recreation services). The decrease in exports reflected decreases in both services (led by travel) and goods (mainly non-automotive capital goods).
The decrease in private inventory investment reflected widespread decreases led by retail trade (mainly motor vehicle dealers) and wholesale trade (mainly durable goods industries). The decrease in nonresidential fixed investment reflected decreases in structures (led by mining exploration, shafts, and wells) and equipment (led by transportation equipment) were partly offset by an increase in intellectual property products (more than accounted for by software). The decrease in state and local government spending reflected a decrease in consumption expenditures (led by compensation).
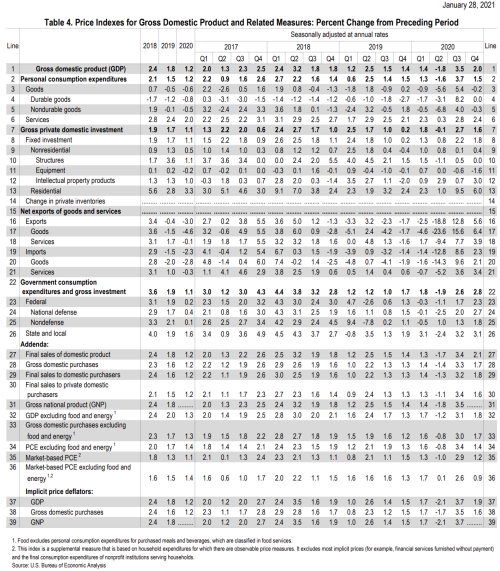
The price index for gross domestic purchases increased 1.2% in 2020, compared with an increase of 1.6% t in 2019 (table 4). The PCE price index also increased 1.2 percent in 2020, compared with an increase of 1.5 percent the year before. Excluding food and energy prices, the PCE price index increased 1.4 percent, compared with an increase of 1.7 percent in 2019.
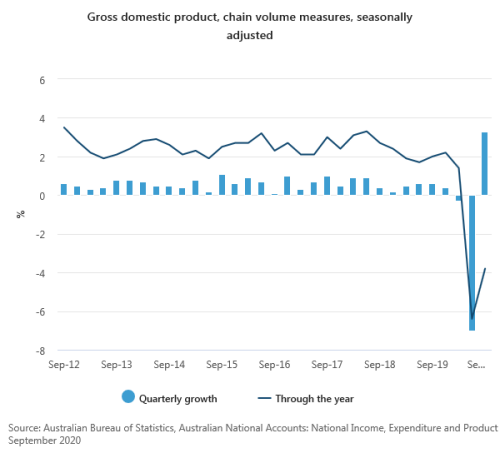
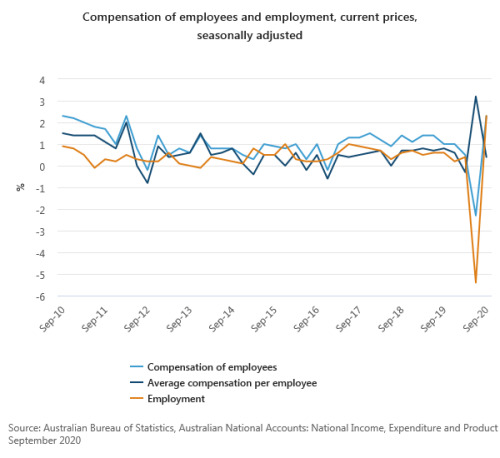
3.2 Australia
Australia’s GDP decreased 3.8 percent in 2020, the customer price index rose 0.9%. The household saving to income ratio declined from its record high last quarter, but remains high at 18.9%. The fall was driven by the partial recovery in household consumption, which outpaced income growth.
Household disposable income grew 3.4%, reflecting increases in both labor and non-labor income as activity in the economy increased.

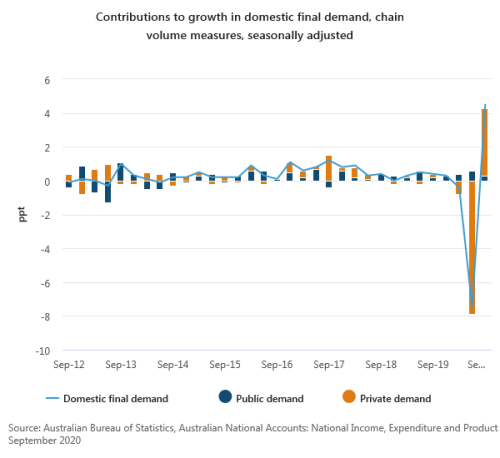
Domestic final demand contributed 4.3 percentage points to GDP growth. Household final consumption expenditure contributed 4.0 percentage points as restrictions were lifted for households and businesses. Public demand contributed a further 0.3 percentage points.
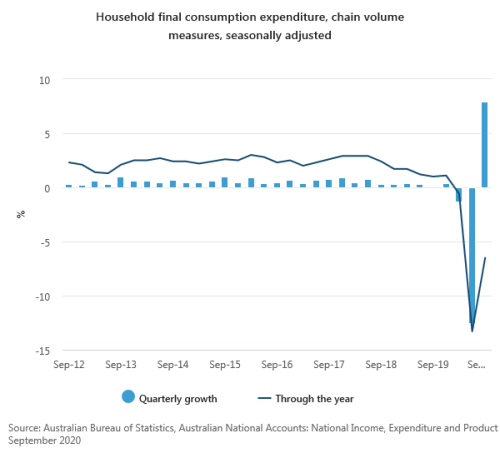
Household spending recovered after falling a record 12.5% in June quarter, household spending rebounded in the fourth quarter, rising 7.9%. Spending remained weak, down 6.5% year-on-year.
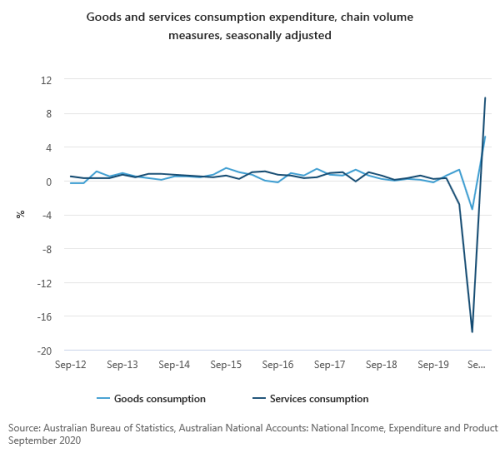
Reductions in social distancing measures and other restrictions encouraged spending on services which rose 9.8%. Hotels, cafes and restaurants, recreation and culture and transport services rebounded. Spending on health services recovered as deferred elective surgeries and visits to medical practitioners resumed.
Spending on goods increased 5.2% in the fourth quarter and were up 3.5% through the year.
Compensation of employees rose 2.3% in the last quarter, reflecting an increase in hours worked and a rise in employment. Average compensation per employee rose 0.4%.
3.3 The United Kingdom
UK gross domestic product (GDP) is estimated to have increased by 1.0% in Quarter 4 (Oct to Dec) 2020 (Figure 1). The level of GDP in the UK is now 7.8% below its 2019 Quarter 4 level.
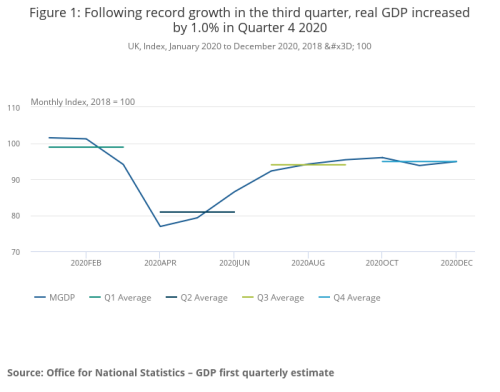
In November 2020, GDP fell by 2.3% as restrictions were put in place to varying degrees across all four nations of the UK. The largest contributor to this fall was accommodation and food service activities, followed by wholesale and retail trade, other service activities and arts, entertainment and recreation, reflecting the reintroduction of restrictions in some parts of the UK. These four sectors accounted for nearly 80% of the fall in services.
GDP increased by 1.2% in December 2020 as restrictions were eased early in the month in many parts of the UK. The largest contributor to this increase was accommodation and food service activities and other services, as the easing of restrictions across many parts of the UK in early December boosted demand for these consumer facing services.
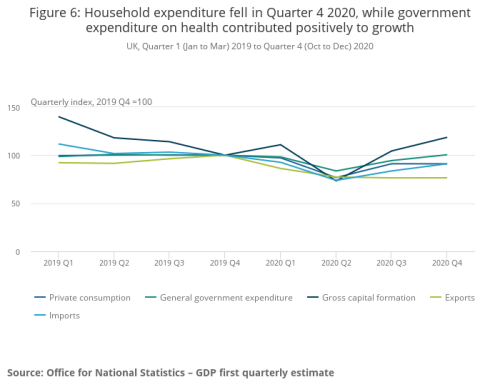
Household consumption
In Quarter 4 2020, household consumption decreased by 0.2%, following a bounce back of 19.3% in Quarter 3 that reflected an easing of public health restrictions. In particular, there was lower spending in restaurants and hotels, which fell by 20.2% because of the reintroduction of restrictions.
These restrictions also affected retail sales, which experienced a 0.4% fall in volume in Quarter 4 2020 according to the latest official retail figures, mainly because of a 4.1% fall in November as a result of enforced closures of non-essential stores in much of the UK. Footfall data on UK high street, retail park and shopping centers show the impact of November restrictions, with UK overall retail footfall falling by around 20 percentage points in this month before recovering to October levels during the first half of December. Meanwhile, household spending on transport increased by 5.9%.
After standing at negative 31 in October and negative 33 in November, the GfK consumer confidence index reported a recovery in December, up to negative 26. This index dropped at the beginning of the pandemic, from negative 7 in February 2020 to negative 34 in April, recovering slowly since June up to the negative 25 points registered in September.
Take a look at the equivalent information in your home country to increase your business resiliency in light of the macro-economic trends.
4. Tips for better sourcing
- Identify the industrial hubs related to your products and their raw materials.
- Some clusters are relocating to central and western China due to rising costs. In order to benefit from cost advantages, keep an eye on industry cluster trends.
- Negotiate from a position of strength by staying up to date with the average product cost structure, raw material prices, and the wage structure in the region that your product is made.
(Sources and references: ar-sourcing.com)
Don’t miss out this valuable business opportunity at the beginning of spring!
Made-in-China.com reserves all the rights for the final explanation.