China Computer Export Volume & Value from Jan. to Sep. in 2015
| Month | Volume | Value(USD) | Y-O-Y | |
| Volume | Value | |||
| Jan. | 138,381,747 | 10,803,353,972 | -9.80% | -19.50% |
| Feb. | 114,155,199 | 9,638,367,357 | 22.50% | -8.40% |
| Mar. | 112,230,428 | 11,273,999,139 | -15.70% | -9.40% |
| Apr. | 122,314,921 | 10,371,919,297 | -16% | -14.30% |
| May | 132,614,050 | 10,849,050,529 | -9.70% | -12.60% |
| Jun. | 136,358,795 | 11,016,556,100 | -6.20% | -13.10% |
| Jul. | 131,488,954 | 11,288,319,122 | -20.70% | -19.60% |
| Aug. | 145,700,290 | 11,101,325,741 | -8.40% | -16.60% |
| Sep. | 148,612,764 | 12,262,912,263 | -1.70% | -7.10% |
| Total | 1,181,857,148 | 98,605,803,520 | -8.60% | -13.60% |
From January to September in 2015, the export volume was 1.18 billion, down 8.6% by year. The export value was USD 98.61 billion, down 13.6% by year. The export average unit price was 83.4 dollars each, keep falling by year.
Major Export Countries for China Computer from Jan. to Sep. in 2015
| No. | Country/Region | Volume | Value(USD) | Y-o-Y | |
| Volume | Value | ||||
| 1 | America | 195,804,339 | 30,686,662,386 | -8.30% | -11.80% |
| 2 | Hong Kong | 365,195,942 | 18,489,530,294 | -9.40% | -6.70% |
| 3 | Netherlands | 59,440,884 | 7,682,808,570 | -21.80% | -31.70% |
| 4 | Japan | 39,471,184 | 5,422,249,316 | -19% | -26.50% |
| 5 | Germany | 27,025,199 | 5,092,475,073 | -15.60% | -13.90% |
| 6 | England | 17,028,549 | 2,918,326,004 | -3.70% | -8.20% |
| 7 | Singapore | 57,722,731 | 2,639,669,074 | -5.50% | -9% |
| 8 | UAE | 14,595,204 | 2,151,110,892 | -11.40% | -13.90% |
| 9 | Korea | 25,647,775 | 2,138,118,825 | -4.60% | -6.20% |
| 10 | Australia | 8,652,820 | 2,065,519,727 | -7.50% | -13.20% |
| 11 | India | 58,966,895 | 2,010,164,399 | -3.80% | 11.40% |
| 12 | Mexico | 21,075,911 | 1,395,621,910 | -11.40% | -7.10% |
| 13 | Canada | 6,017,907 | 1,229,019,529 | -10.30% | -12.30% |
| 14 | Czech | 19,611,838 | 1,138,213,628 | -29.30% | -10% |
| 15 | Taiwan | 48,475,569 | 1,113,047,180 | 88.10% | -7.30% |
| 16 | Luxembourg | 2,401,085 | 1,025,041,022 | 185.20% | 146.50% |
| 17 | Italy | 5,049,791 | 977,292,936 | -16.80% | -8.80% |
| 18 | Russia | 10,356,260 | 793,247,526 | -8.70% | -33.30% |
| 19 | Thailand | 15,921,907 | 753,353,105 | 38.90% | 11% |
| 20 | France | 7,095,752 | 729,837,175 | -24.10% | -23.90% |
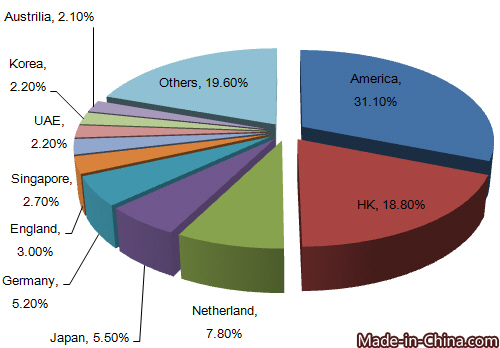
From January to September in 2015, the export data shows that America, Hong Kong, Netherlands, Japan, Germany, England, Singapore, UAE, Korea and Australia topped the country list for China computer export. The export value to America, Hong Kong and Netherlands accounted for 31.1%, 18.8%, and 7.8% of China’s computer total export value respectively.
From January to September in 2015, in the top 20 export markets, the export value to Luxembourg grew fastest, 146.5% higher than that in 2014.
Distribution of China Computer Origins from Jan. to Sep. in 2015
| No. | Region | Volume | Value(USD) | Y-o-Y | |
| Volume | Value | ||||
| 1 | Jiangsu | 186,917,409 | 23,932,369,089 | -6.80% | -0.90% |
| 2 | Guangdong | 678,050,051 | 23,225,157,536 | -11% | -8.80% |
| 3 | Shanghai | 81,082,554 | 19,689,641,175 | -22.20% | -22.60% |
| 4 | Chongqing | 59,687,934 | 15,142,211,619 | 7% | -17.30% |
| 5 | Sichuan | 23,400,487 | 7,245,150,631 | -17.90% | -20.30% |
| 6 | Shandong | 25,905,723 | 2,260,180,511 | -9.40% | -47.70% |
| 7 | Anhui | 7,129,778 | 1,605,203,581 | -5.40% | -24.20% |
| 8 | Fujian | 40,935,906 | 1,082,705,565 | 60.90% | -20.60% |
| 9 | Shanxi | 9,425,810 | 1,055,869,602 | 206.90% | 129.60% |
| 10 | Zhejiang | 19,272,700 | 874,188,316 | -18.40% | -17.40% |
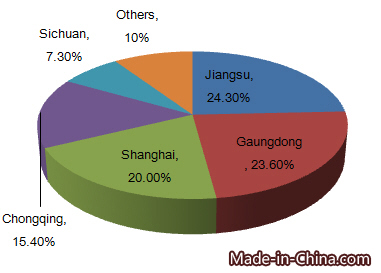
From January to September in 2015, Jiangsu, Guangdong, Shanghai and Chongqing are the major origins for China’s computer export. The above four regions’ export value accounted for 24.3%, 23.6%, 20% and 15.4% respectively and the sum was 82.4%.


