Export Origins of China's Electric Sound or Visual Signal Applications in 2015
| No. | District | Export Value(USD) | Proportion |
| 1 | Guangdong | 1,870,950,134 | 55.27% |
| 2 | Zhejiang | 461,548,573 | 13.63% |
| 3 | Jiangsu | 315,663,308 | 9.33% |
| 4 | Shanghai | 254,566,740 | 7.52% |
| 5 | Liaoning | 131,295,516 | 3.88% |
The top export origins of China's electric sound or visual signal applications were Guangdong province and Zhejiang province in 2015.
Destinations for China's Electric Sound or Visual Signal Applications in 2015
| No. | Country/Region | Export Value | on Year | ||
| Volume(Unit) | Value(USD) | Volume | Value | ||
| 1 | United States | 153,050,982 | 845,388,475 | 8.30% | 13.40% |
| 2 | Hong Kong | 566,739,818 | 721,766,781 | 4.60% | 1.30% |
| 3 | United Kingdom | 34,914,253 | 209,667,726 | 37.50% | 36.80% |
| 4 | Germany | 50,632,859 | 194,262,302 | -2.40% | 10.80% |
| 5 | Netherlands | 21,212,649 | 170,290,102 | 38.40% | 43.80% |
| 6 | Japan | 109,801,224 | 147,416,062 | -3.20% | -9% |
| 7 | France | 23,827,212 | 136,502,519 | 68.30% | 38% |
| 8 | Canada | 7,029,491 | 64,842,278 | -19.60% | -2.80% |
| 9 | Korea | 61,421,331 | 64,209,029 | -7% | 11.90% |
| 10 | Russian Federation | 14,835,845 | 47,693,883 | -9.40% | -26.50% |
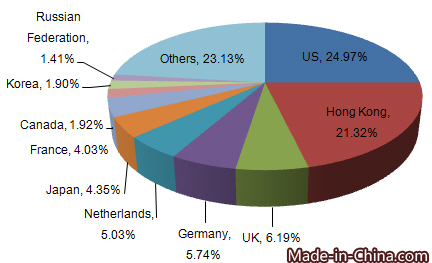
From January to December in 2015, the top destinations for China's electric sound or visual signal applications were the United States, Hong Kong and the United Kingdom.
Major Electric Sound or Visual Signal Applications Demanded Countries in 2015
| Importer | Import Value(USD) | on Year |
| United States | 3,159,556,000 | 2.05% |
| Germany | 1,462,898,000 | -20.83% |
| Vietnam | 1,247,684,000 | 2128.29% |
| Hong Kong | 1,021,471,000 | -6.44% |
| Korea | 955,788,000 | -20.70% |
From January to December in 2015, the United States was the largest electric sound or visual signal applications importers.
Major Electric Sound or Visual Signal App Exporting Countries in 2015
| Exporter | Export Value(USD) | On Year |
| Korea | 5,661,193,000 | 11.51% |
| China | 3,385,509,000 | 9.56% |
| Taiwan | 2,741,705,000 | -22.54% |
| United States | 1,838,888,000 | -0.70% |
| Hong Kong | 1,377,347,000 | -5.02% |
From January to December in 2015, Korea was the largest exporter of electric sound or visual signal applications and its export value was USD 5,661,193,000.