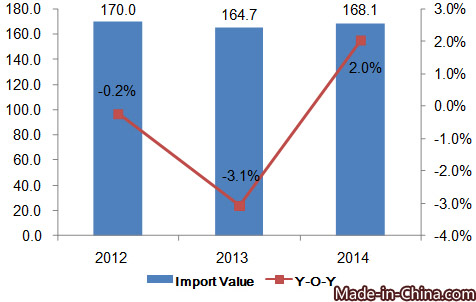
Annual Trend of Japan’s Computer Import Value from 2012 to 2014

Japan’s computer import value was USD 17 billion in 2012, USD 16.47 billion in 2013 and USD 16.81 billion in 2014.
The Trend of Japan’s Computer Import Market from 2012 to 2014
| No. | Country/Region | Import Value(USD) | 2014’s Growth from 2012 | ||
| 2012 | 2013 | 2014 | |||
| Total | 16,997,102,000 | 16,473,881,000 | 16,805,957,000 | -1.10% | |
| 1 | China | 13,079,585,000 | 13,133,803,000 | 13,307,421,000 | 1.70% |
| 2 | America | 804,609,000 | 702,242,000 | 815,747,000 | 1.40% |
| 3 | Thailand | 742,242,000 | 604,798,000 | 580,385,000 | -21.80% |
| 4 | Singapore | 640,569,000 | 552,206,000 | 570,704,000 | -10.90% |
| 5 | Taiwan | 256,847,000 | 261,516,000 | 318,648,000 | 24.10% |
| 6 | Philippines | 331,669,000 | 321,103,000 | 269,828,000 | -18.60% |
| 7 | Malaysia | 264,950,000 | 227,545,000 | 200,083,000 | -24.50% |
| 8 | Mexico | 136,029,000 | 90,499,000 | 166,084,000 | 22.10% |
| 9 | Korea | 293,023,000 | 164,428,000 | 136,111,000 | -53.50% |
| 10 | Germany | 90,122,000 | 92,485,000 | 99,698,000 | 10.60% |
In 2013, China is the largest computer import origin for Japan, followed by America and Thailand. Japan’s computers imports from China accounted for about 80% of its total import.
The Trend of Japan’s Computer Import Market Share from 2012 to 2014
| No. | Country/Region | Import Value Share | ||
| 2012 | 2013 | 2014 | ||
| 1 | China | 77.00% | 79.70% | 79.20% |
| 2 | America | 4.70% | 4.30% | 4.90% |
| 3 | Thailand | 4.40% | 3.70% | 3.50% |
| 4 | Singapore | 3.80% | 3.40% | 3.40% |
| 5 | Taiwan | 1.50% | 1.60% | 1.90% |
| 6 | Philippines | 2.00% | 1.90% | 1.60% |
| 7 | Malaysia | 1.60% | 1.40% | 1.20% |
| 8 | Mexico | 0.80% | 0.50% | 1.00% |
| 9 | Korea | 1.70% | 1.00% | 0.80% |
| 10 | Germany | 0.50% | 0.60% | 0.60% |
From 2012 to 2014, Taiwan and Germany’s market share kept growing while Thailand, Philippines, Malaysia and Korea’s continued falling.
Japan’s Computer Import Market from Jan. to Sep. in 2015
| Country/Region | Import Value(USD) | Y-O-Y | Percentage |
| Total | 10,237,416,000 | -20.30% | 100.00% |
| China | 7,926,465,000 | -22.70% | 77.40% |
| America | 478,072,000 | -22.70% | 4.70% |
| Singapore | 413,550,000 | 1.50% | 4.00% |
| Thailand | 389,843,000 | -13.00% | 3.80% |
| Taiwan | 216,594,000 | -6.10% | 2.10% |
| Philippines | 201,291,000 | -3.70% | 2.00% |
| Malaysia | 116,834,000 | -23.00% | 1.10% |
| Mexico | 95,750,000 | -17.40% | 0.90% |
| Korea | 77,564,000 | 24.10% | 0.80% |
| Germany | 67,543,000 | -10.10% | 0.70% |
From January to September in 2015, the total value of Japan’s import computer was USD 10.24 billion, down 20.3% by year. China was the largest import market for Japan. The value of computers Japan imported from China in 2015 accounted for about 77.4% of it’s the total.


