China Insulator Export Volume and Value from Jan. to Dec. 2014
| Month | Volume(Kg) | Value (USD) | Compared to the Same Period of Last Year | |
| Volume | Value | |||
| Jan. | 23,763,641 | 48,569,930 | -7.1% | 5.7% |
| Feb. | 13,036,946 | 25,789,630 | -28.8% | -23% |
| Mar. | 20,870,856 | 40,032,581 | -20.9% | -14.4% |
| Apr. | 19,908,996 | 42,243,313 | -27.8% | -11.4% |
| May | 20,011,073 | 41,174,716 | -5.6% | -15.5% |
| Jun. | 17,979,883 | 36,234,190 | -16.5% | -19.1% |
| Jul. | 23,694,684 | 47,321,575 | 0.3% | -8.5% |
| Aug. | 23,278,331 | 49,790,517 | 4.8% | 6.5% |
| Sep. | 20,976,022 | 48,899,555 | -0.7% | 5.5% |
| Oct. | 27,311,535 | 53,101,782 | 4.7% | 6% |
| Nov. | 24,895,059 | 51,554,398 | 5.4% | 2.1% |
| Dec. | 23,620,306 | 49,363,867 | -11.9% | -10.7% |
| Jan. to Dec. in Total | 259,347,332 | 534,076,054 | -8.7% | -6% |
From Jan. to Dec. 2014, China’s insulator export value is up to US $ 534 million, down 6%.
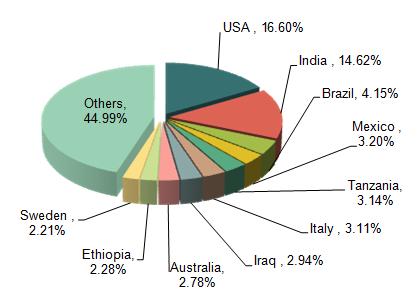
China Insulator Major Export Countries/Regions Distribution from Jan. to Dec. 2014
| No. | Countries | Volume(Kg) | Value (USD) | Compared to the Same Period of Last Year | |
| Volume | Value | ||||
| 1 | USA | 36,143,638 | 88,654,531 | -0.8% | -5.8% |
| 2 | India | 41,195,875 | 78,074,361 | -32% | -26.5% |
| 3 | Brazil | 12,393,434 | 22,140,790 | 22.5% | 13.2% |
| 4 | Mexico | 9,676,720 | 17,079,036 | 34% | 11.3% |
| 5 | Tanzania | 5,147,271 | 16,780,727 | 867.1% | 1199.1% |
| 6 | Italy | 7,630,815 | 16,594,525 | -6.8% | -10.9% |
| 7 | Iraq | 10,691,555 | 15,690,862 | 19.5% | 39.6% |
| 8 | Australia | 6,206,641 | 14,837,839 | 6.7% | 4.7% |
| 9 | Ethiopia | 8,038,750 | 12,174,164 | 363.2% | 191% |
| 10 | Sweden | 4,355,247 | 11,789,417 | / | -1.7% |

From the Jan. to Dec. 2014 export data we can see, China’s Insulator major export market is the USA, India, Brazil, Mexico, Tanzania, Italy, Iraq, Australia, Ethiopia and Sweden and so on.
Instead of India, USA has become the largest Insulator export market in 2014, in Jan. to Dec.2014, China’s insulator cumulative export value to the USA is approximately US $ 88.65 million, down 5.8%, 16.6% of China's total export of the product. Followed by India, is 14.62% of market share.
From Jan. to Dec. 2014, among the top ten insulator export markets, China's exports to Tanzania has considerably increased, export volume grows by 867.1%,export value rises 1199.1%.
China Insulator Export Original Places from Jan. to Dec. 2014
| No. | Regions | Volume(Kg) | Value (USD) | Compared to the Same Period of Last Year | |
| Volume | Value | ||||
| 1 | Zhejiang | 25,154,400 | 81,223,288 | 56.9% | 51% |
| 2 | Jiangsu | 29,962,396 | 75,572,274 | -38.9% | -30.2% |
| 3 | Hunan | 45,045,158 | 63,258,891 | -4.6% | 2.7% |
| 4 | Liaoning | 21,027,954 | 52,359,855 | -19.7% | -20.4% |
| 5 | Shanghai | 20,421,640 | 48,162,814 | 41.1% | 20.4% |
| 6 | Fujian | 34,654,093 | 43,293,013 | -2.3% | -5.6% |
| 7 | Shandong | 20,000,024 | 35,173,342 | 18.9% | 17% |
| 8 | Guangdong | 5,425,356 | 32,280,307 | -10.7% | -8.5% |
| 9 | Hebei | 13,440,379 | 28,879,445 | -14.7% | -0.9% |
| 10 | Sichuan | 23,999,473 | 28,549,726 | -7.7% | -9.7% |
Zhejiang, Jiangsu and Hunan are China’s insulator major export original places, in Jan. to Dec.2014, the export volume of the above three provinces accounts for 38.62%, and the export value accounts for 41.2% of the total of the product in China.
Source: China Customs


